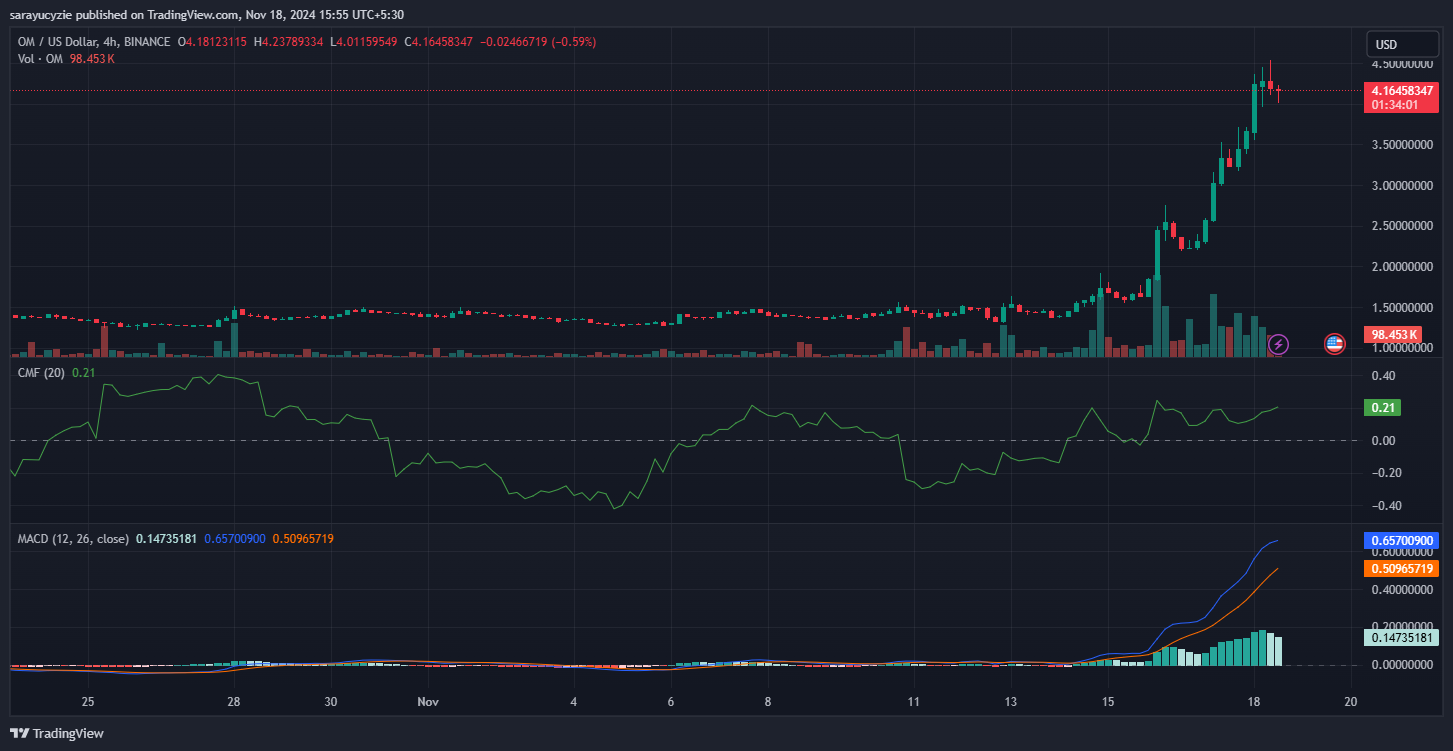
- Mantra has experienced a 191% gain in the past seven days.
- OM trades at $4.18, with its ATH standing at $4.47.
The crypto market is moderately bullish, with the total market cap settled at $3.09 trillion. The largest cryptocurrency, Bitcoin, trades at $91.8K. The asset’s dominance led the altcoins to surge. While Ethereum (ETH) rests at the $3.1K mark.
Investors are focusing on the promising altcoins, as the alt-season is looming. Among the altcoins, MANTRA (OM) has hit its all-time high at $4.47 and is listed in the top five gainers. The asset’s positive outlook with a 25.52% gain drove it to trade higher for the day.
As of writing, OM is traded at $4.18 with a market cap of $3.73 billion. During this timeframe, CMC data revealed that Mantra’s daily trading volume was $769 million. Meanwhile, the asset has witnessed a 24-hour liquidation of $7.64 million.
Over the past seven days, Mantra has gained over 191%. It began trading at $1.39. The mid-week high is marked at $1.84, and the asset steadily soared to the current price levels.
On the other side, a whale has deposited 600K OM worth $2.55 million to Binance. The whale had previously withdrawn 1.49 million OM in June 2023. With 889K Mantra valued at $3.76 million still held, its estimated profit stands at $6.26 million.
Notably, whale activity has increased as the asset’s price hikes. As per on-chain data, on Nov 16, a whale withdrew 1.2 million OM from Binance. The whale’s estimated profit now stands at $36.94 million.
Can OM Keep Its Bullish Trend Alive?
OM’s Moving Average Convergence Divergence (MACD) line rests above the signal line, inferred by the four-hour technical chart. It suggests the upside pressure and an impending positive sentiment.

Besides, the Chaikin Money Flow (CMF) indicator is located at 0.21, indicating a positive money flow with buyers steering the market. Meanwhile, the trading volume of OM has surged by over 33.85%.
According to analysts, if the asset’s positive sentiment remains strong, it can effortlessly break the all-time high. While assuming an extended gain of OM, the asset’s bull might lead the price to a potential $5.40 mark. This upside trajectory of the asset could even trigger the price to hit $7.
On the support side, if a bearish trajectory appears, the asset’s price could slide to $3.62. Further declines in Mantra might push the price to plummet even lower to the $1 range.
Moreover, the asset is in the overbought territory in the market, as suggested by the daily relative strength index (RSI), situated at 82.82. In addition, the daily frame of Mantra exhibits the short-term 9-day MA above the long-term 21-day MA.
Disclaimer: The opinion expressed in this chart is solely the author’s. It does not represent any investment advice. TheNewsCrypto team encourages all to do their own research before investing.
 thenewscrypto.com
