NVT Ratio: How Much Is Your Bitcoin Really Worth
Recently, we touched upon the topic of crypto trading, where our experts, who trade digital assets themselves, noted the importance of an analytical approach in making trading decisions. It is the market analysis that can give you an opportunity to make profits at maximum or not to lose, but try your hand in trading at least. Let's take a look at one of these analytical tools that helps to determine whether the bubble is inflated or the actual value of a digital asset is really growing, when to go long, and when to go short. And let's try to figure out whether it is reasonable to buy Bitcoin now, when its rate reached a multi-month low of $5,504 (at the time of writing), considering some of the forecasts of its growth at the end of the year to reach $15,000.
This material will cover an analogue of the P/E ratio - the ratio of the market price of shares to the company's profit, which is widely used in the traditional sector to assess the real value of the asset, and therefore its investment attractiveness.
By definition cryptocurrencies are not securities and are not issued by any company, so when estimating their value it is impossible to take profit figures performed by any organization. But in its essence each virtual coin create a network of payments and storage of value, and cryptocurrency analysts Chris BURNISKE and Willy WOO have concluded that a company’s profit indicator can be replaced by the volume of capital that is transferred through the network, in other words - the daily transaction value in US dollars. In order to make sure their conclusion was correct, the researchers analyzed the relation of the market value of the cryptocurrency blockchain, expressed in its market capitalization, and the value of the capital transferred via it - the daily value of operations. As a result, a strong correlation between these two indicators was found. So, the higher the transaction value is, the greater the blockchain worth is, as well as the higher the investment attractiveness of the digital asset is.
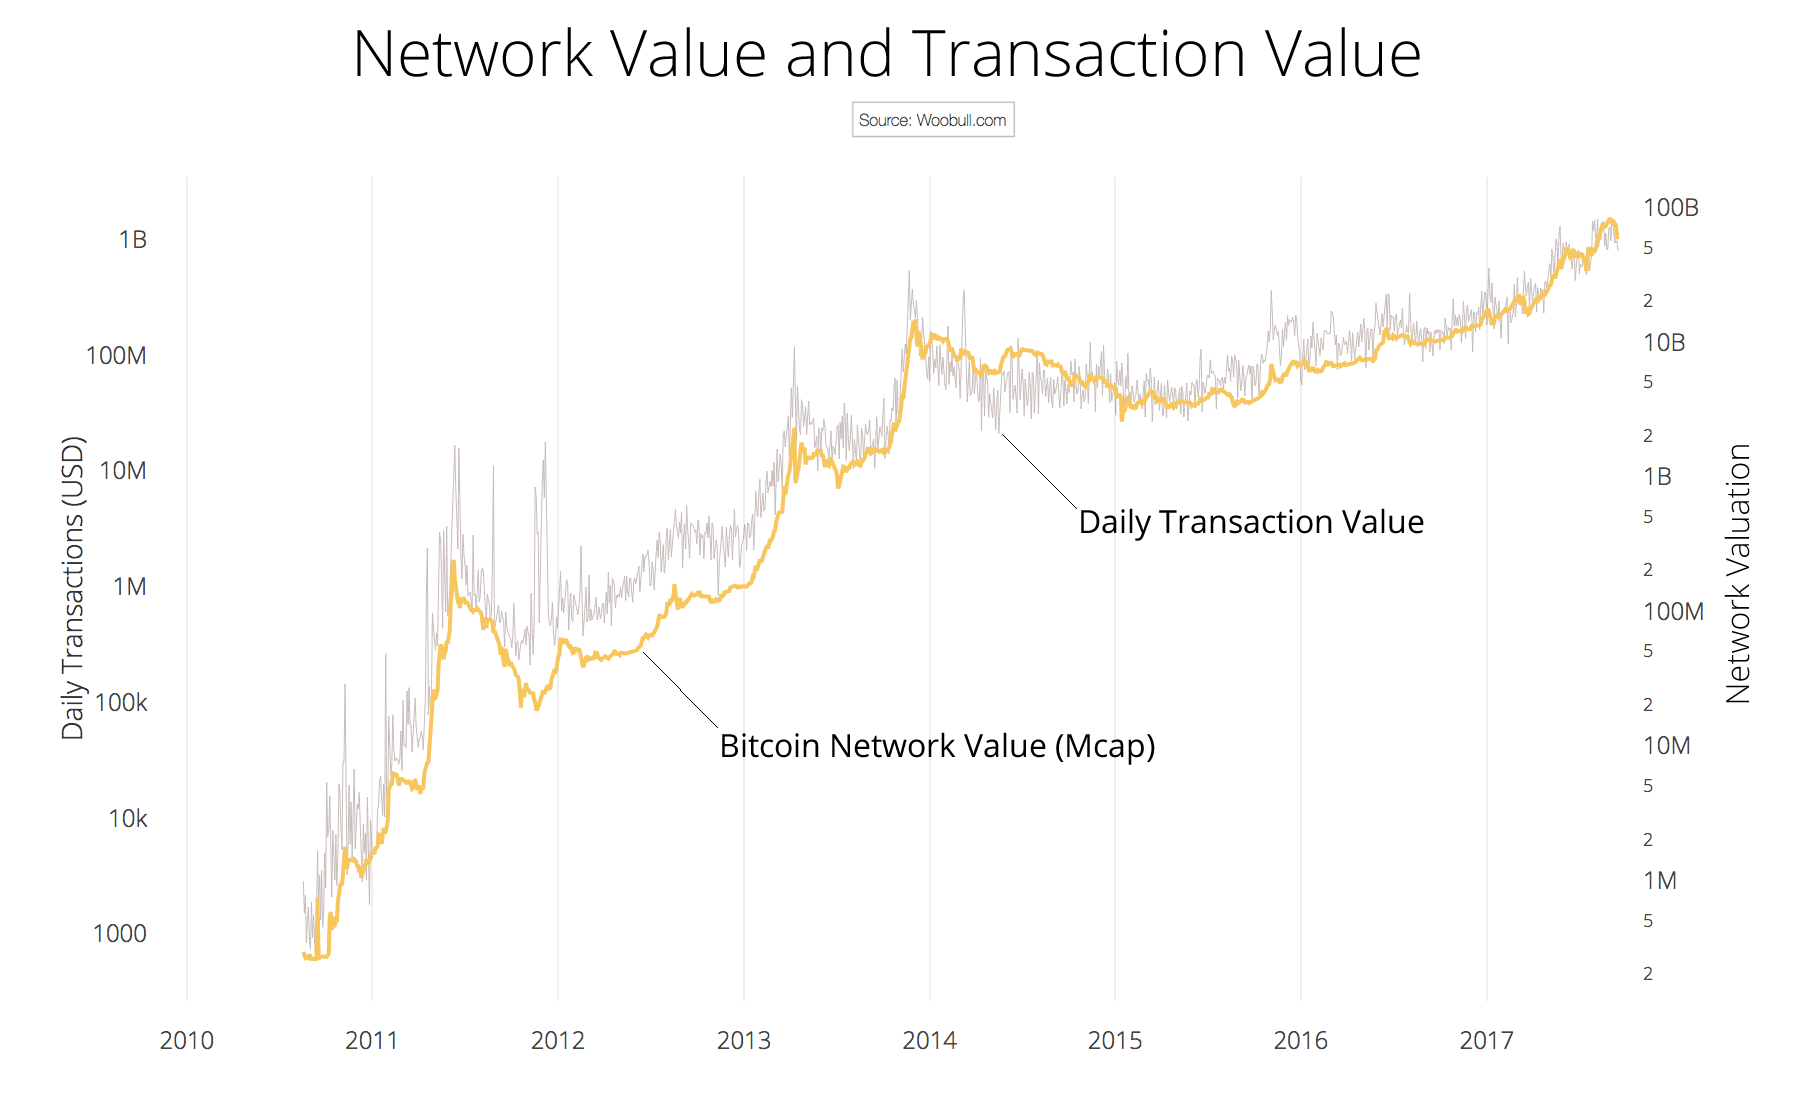
(source: www.woobull.com)
Thus, a cryptocurrency analogue of the P/E is called the Network Value to Transactions Ratio (NVT), which shows how a market price of a cryptocurrency is ensured by its practical use as a means of payment.
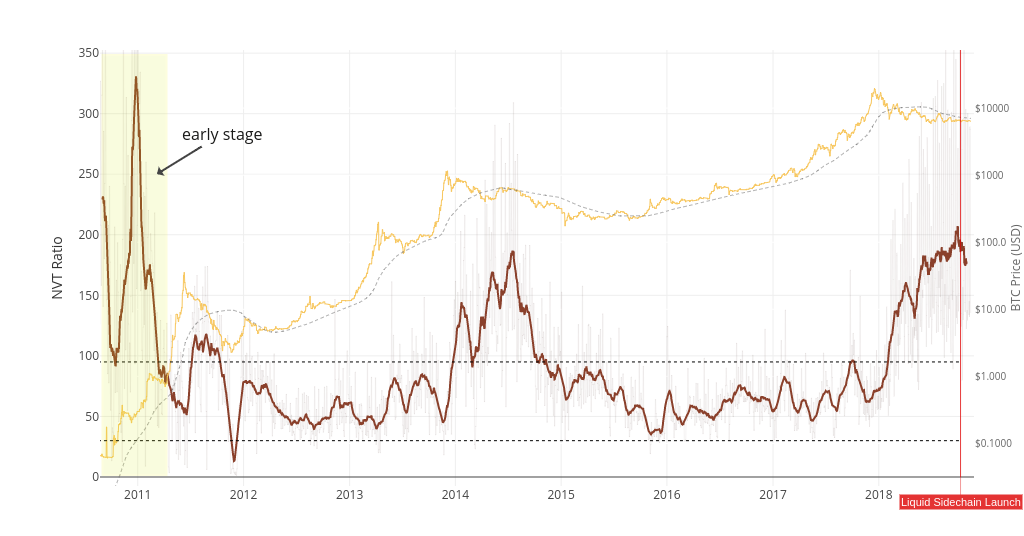
(yellow line - the market capitalization of Bitcoin, gray - NVT ratio, red - smoothed NVT, two parallel dotted lines - the normal NVT range)
As you can see on the chart above, in the early years of the Bitcoin blockchain the market capitalization exceeded the actual transaction value. This is due to the fact that investors saw the potential of the technology and invested in it. A similar situation takes place when promising young startups that may have not launched a product on the market and started generating profits yet, have already managed to attract venture financing. Therefore, the utilization of the NVT ratio for the evaluation of new crypto assets is useless as well as for hidden and untraceable currencies like Zcash. But once an asset enters its maturity phase, NVT helps to determine when the market is overheated by speculation and the inflated market price will seek a balance with its intrinsic value.
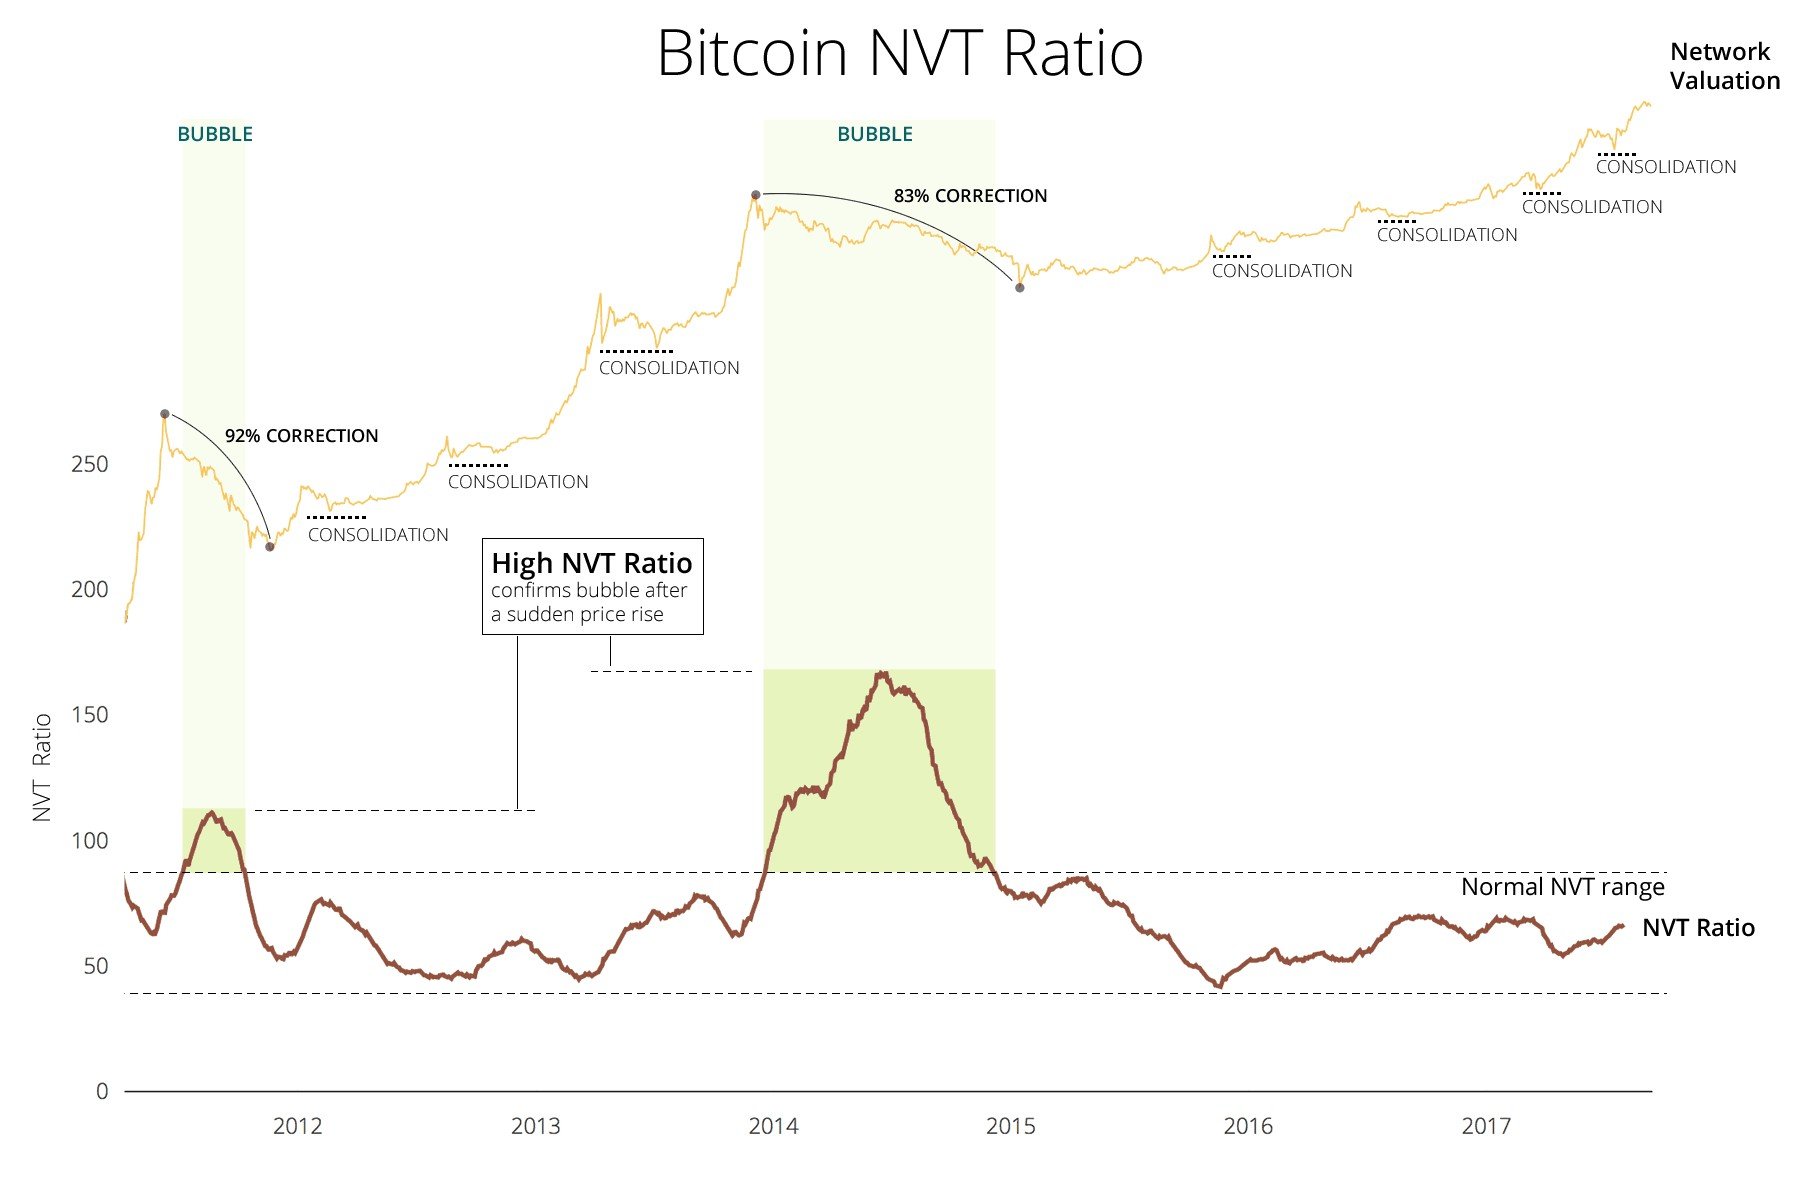
(source: www.woobull.com)
As long as the ratio line is within the normal range, there is no bubble. If the price explosion still occurs, and the NVT line does not cross the upper limit, then we can talk about the normal consolidation, since with the market capitalization growth the daily transaction value increase, and when the price stabilize, it maintains its new increased value and hence there is no significant collapse.
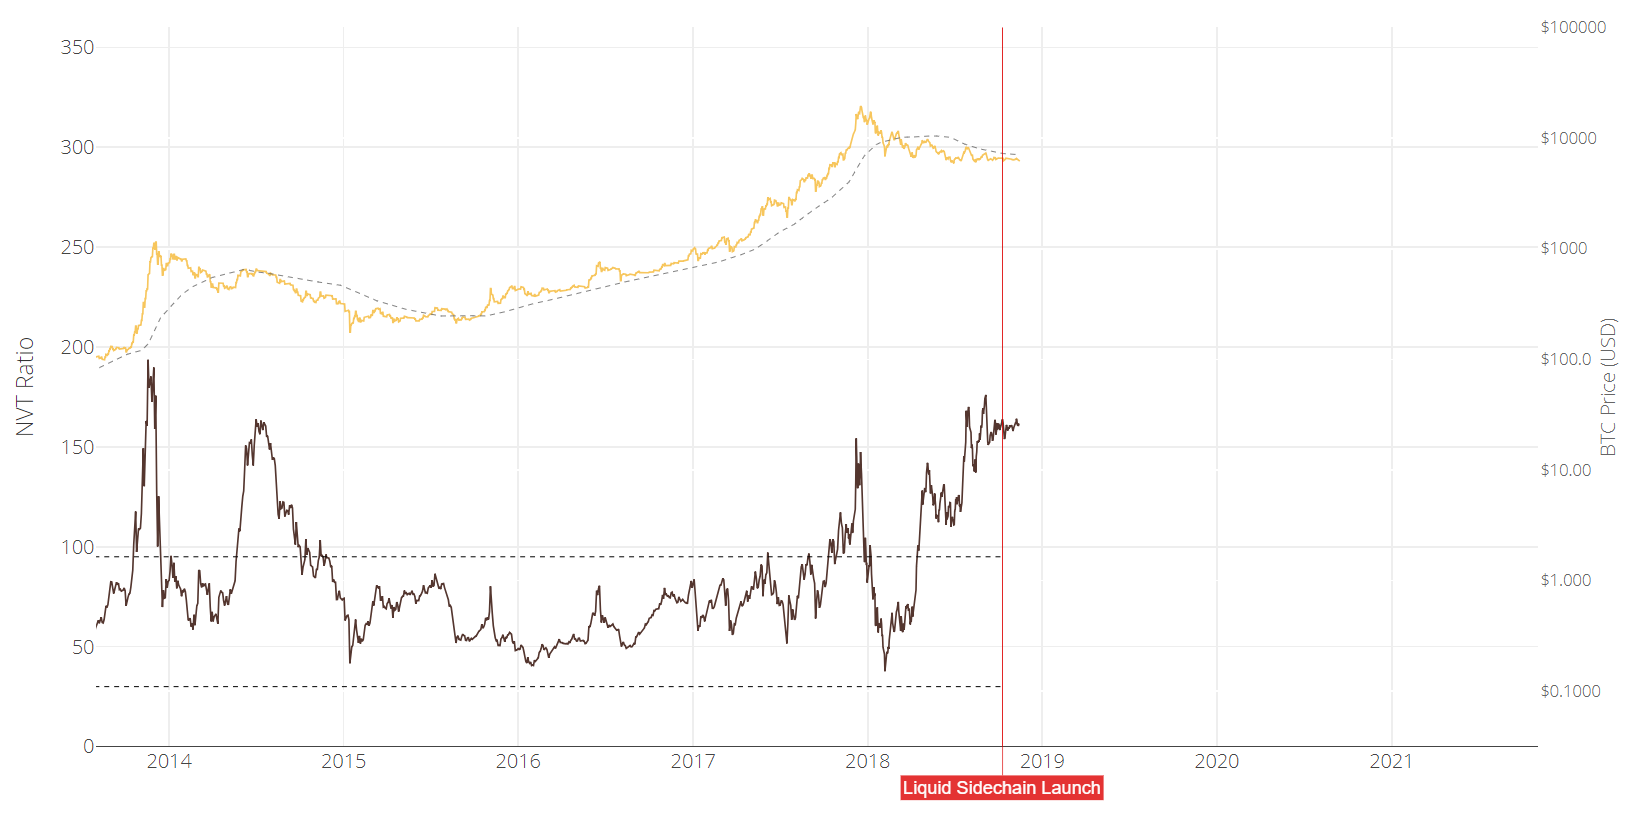
The modified version, where the daily transaction value is smoothed by using a moving average, is called NVT Signal and allows you to more accurately determine the overvaluation of the network.
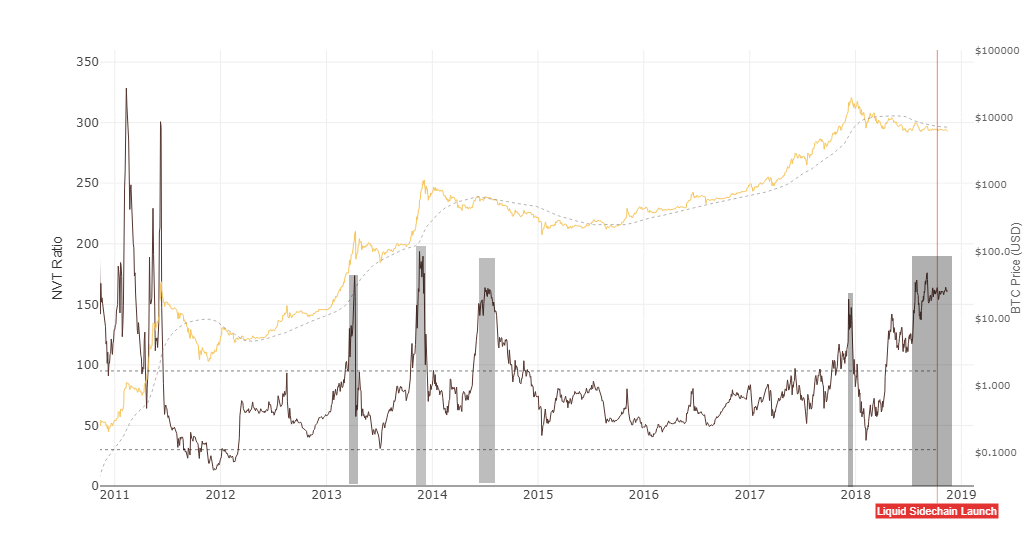
(gray areas - overvaluation of Bitcoin or when the coins were overbought)
Willy WOO notes that the Bitcoin overbought period can be identified when the NTV Signal line breaks the mark of 150. According to the chart above, it becomes clear that this situation happened at the end of 2017, when the price of the currency reached $20,000, and the daily transaction value exceeded $13 bn. And by February, half of the traders sold their digital assets, which resulted in the daily transaction value barely topping $7 bn, which can be seen on the level below 45.
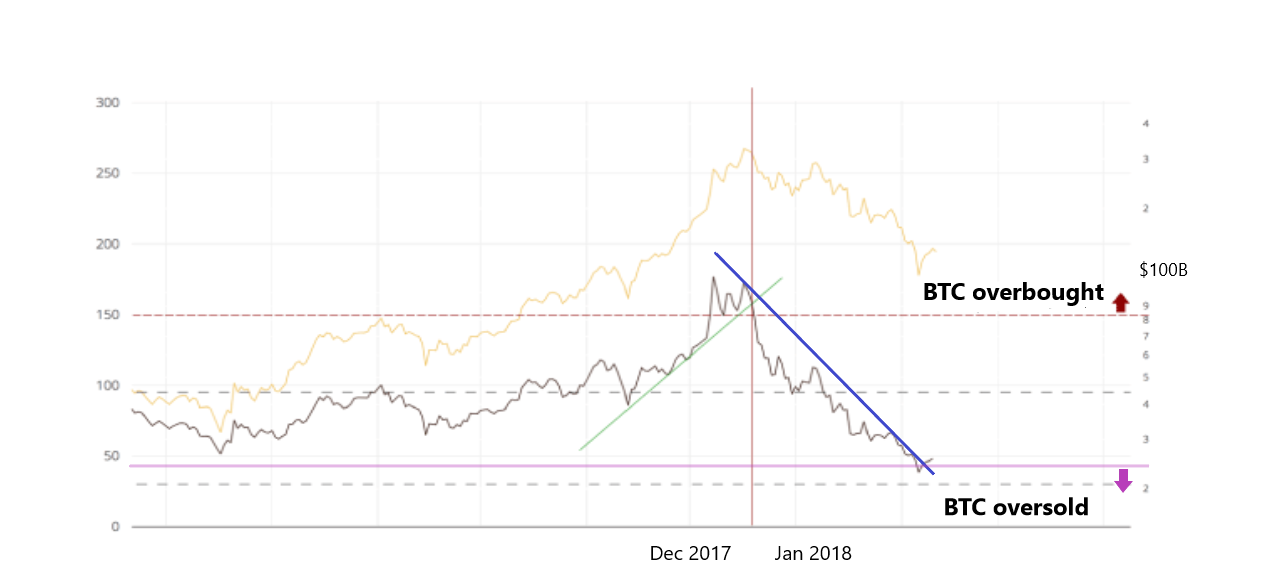
(green line - support line, blue line - resistance line)
In order to determine the most favorable moment for selling coins, you can build a support line and at the moment of its intersection with the NVT Signal line sell and make profits. Meanwhile, a trader can also open a short position to sell the asset at the highest possible price, and then purchase it back at a lower cost and get the margin. In turn, a long position should be opened when there is a break of a bearish trend, when the asset value is expected to rise. To do this, you need to build a resistance line and buy an asset of interest at the lows.
As for the current situation, the chart shows that the main digital currency is overbought while the transaction activity is relatively low, which may not be the most favorable moment for going long. However, it is worth noting that the technical and fundamental analysis of the markets involve the complex use of various indicators in order to make the most successful trading and investment decision, and despite the fact that the NVT ratio has proved its effectiveness, it is just one of them.