Here’s What a $1,000 Bitcoin Investment 10 Years Ago Would Be Worth Today
Over the past decade, Bitcoin has grown from a niche digital experiment into one of the world’s most influential investment assets. Its long-term performance has been shaped by dramatic surges, deep corrections, regulatory milestones, exchange failures, and strong institutional inflows. Because of this remarkable trajectory, many investors wonder how much an early Bitcoin position would be worth today.
This article outlines key points, walks through Bitcoin’s price action from 2015 to 2025, and explains exactly how much a $1,000 Bitcoin investment from ten years ago would be worth today.
Bitcoin price history from 2015 to 2025
Bitcoin’s price over the last decade shows how volatile, unpredictable, and rewarding the asset can be. The period began with one of the harshest market declines in Bitcoin’s history, followed by multiple record-breaking bull markets and long stretches of consolidation.
2015: Aftermath of the Mt. Gox exchange collapse
When the Mt. Gox exchange failed in 2014, confidence in Bitcoin collapsed. The price fell from around $1,000 in late 2013 to $218 at the lows. That represented a decline of roughly 75 percent. For most of 2015, Bitcoin traded in the low hundreds. The market finally began to recover toward the end of 2015, when the price climbed back above $430.
Despite the weak sentiment, several large companies such as Dell, Newegg, and Zynga experimented with Bitcoin payments. This period laid the foundation for the recovery that followed.
2016–2017: A full recovery and Bitcoin’s first global mania
Bitcoin entered a powerful uptrend in 2016. It rose from about $430 at the start of the year to almost $20,000 by December 2017. The gains exceeded 3,100 percent. By late 2017, interest in cryptocurrencies surged internationally, supported by media coverage, retail demand, and the rise of ICOs. Bitcoin finished 2017 at more than $14,000 and became a household name for the first time.
2018–2023: Crypto winter, a global rebound, and the 2021 all-time high
The cycle that followed was much more turbulent. During 2018, Bitcoin fell below $10,000 and bottomed near $4,000. The market remained quiet until mid-2020. The economic uncertainty and large liquidity injections during the COVID period pushed Bitcoin into another strong rally.
In early 2021, Bitcoin broke $50,000, then $60,000, and later reached a then-ATH of $68,770 in November. The excitement faded during 2022. Bitcoin dropped below $20,000 and stayed weak for months. By late 2023, however, the market turned around, and Bitcoin closed the year above $42,000.
2024: ETF-driven demand and a renewed surge
The approval of spot Bitcoin ETFs in the United States in January 2024 changed the market significantly. The new products opened the door for traditional investors and large funds. Bitcoin rose from around $43,000 at the start of the year to $73,608 in March. After several months of trading near $60,000, another rally began in November. Bitcoin reached $94,837 ahead of the US election and later crossed $100,000 for the first time in December. The price climbed as high as $106,052 before the end of the year.
2025: A new all-time high and a sharp correction
Bitcoin carried its momentum into early 2025 and reached a new all-time high of $126,025. A correction followed. Throughout November 2025, Bitcoin fell from the $110,000 range toward the mid and upper $80,000s. On November 25, Bitcoin closed at $88,271. The decline was notable but still consistent with the volatility that typically follows major peaks.
How much would a $1,000 Bitcoin investment 10 years ago be worth today?
A $1,000 Bitcoin investment made in early 2015, when the price was around $250, would have purchased roughly 4 BTC. With Bitcoin now trading around $87,000, that position would be worth about $350,000.
This represents a return of 34,700%. It is one of the clearest examples of how Bitcoin has rewarded long-term holders.
If you are curious about the potential return of an investment you are considering, you can use the CoinCodex profit calculator.
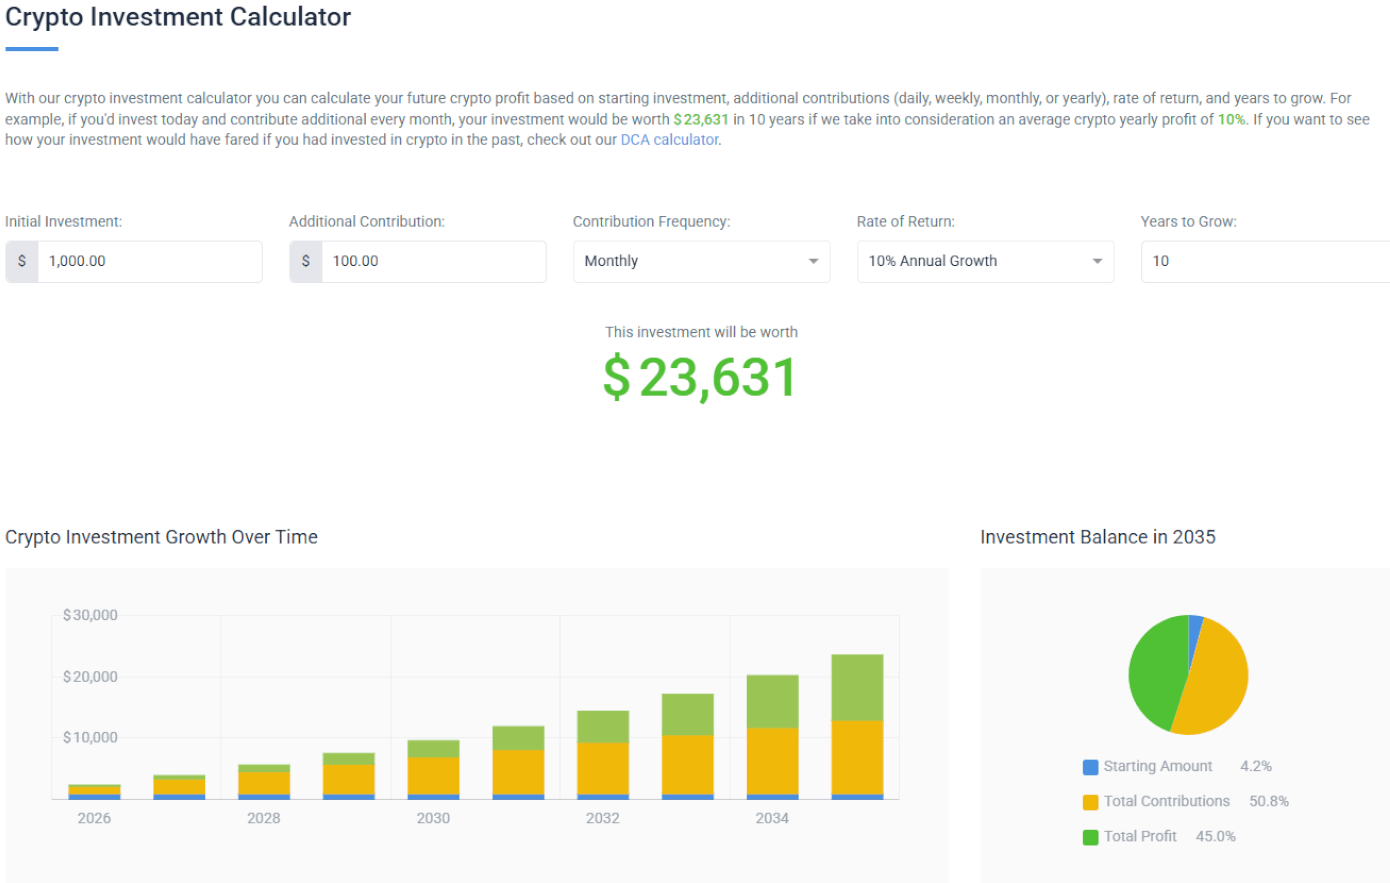
The investment calculator example shows how a $1,000 initial investment with monthly contributions of $100 would grow over 10 years at an annual return of 10%.
The tool automatically shows how an investment grows over a selected time period, and includes a table that clearly breaks down the value of your initial investment and any additional contributions year by year, both in percentage terms and in absolute dollar amounts. That way, you can instantly determine whether or not an investment is worth your time.
Dollar cost averaging as a long-term approach
Not all investors prefer a lump sum purchase. Dollar cost averaging, or DCA, spreads buys across regular intervals. This reduces the impact of volatility and makes the process more predictable, which makes it a great option for the volatile crypto market.
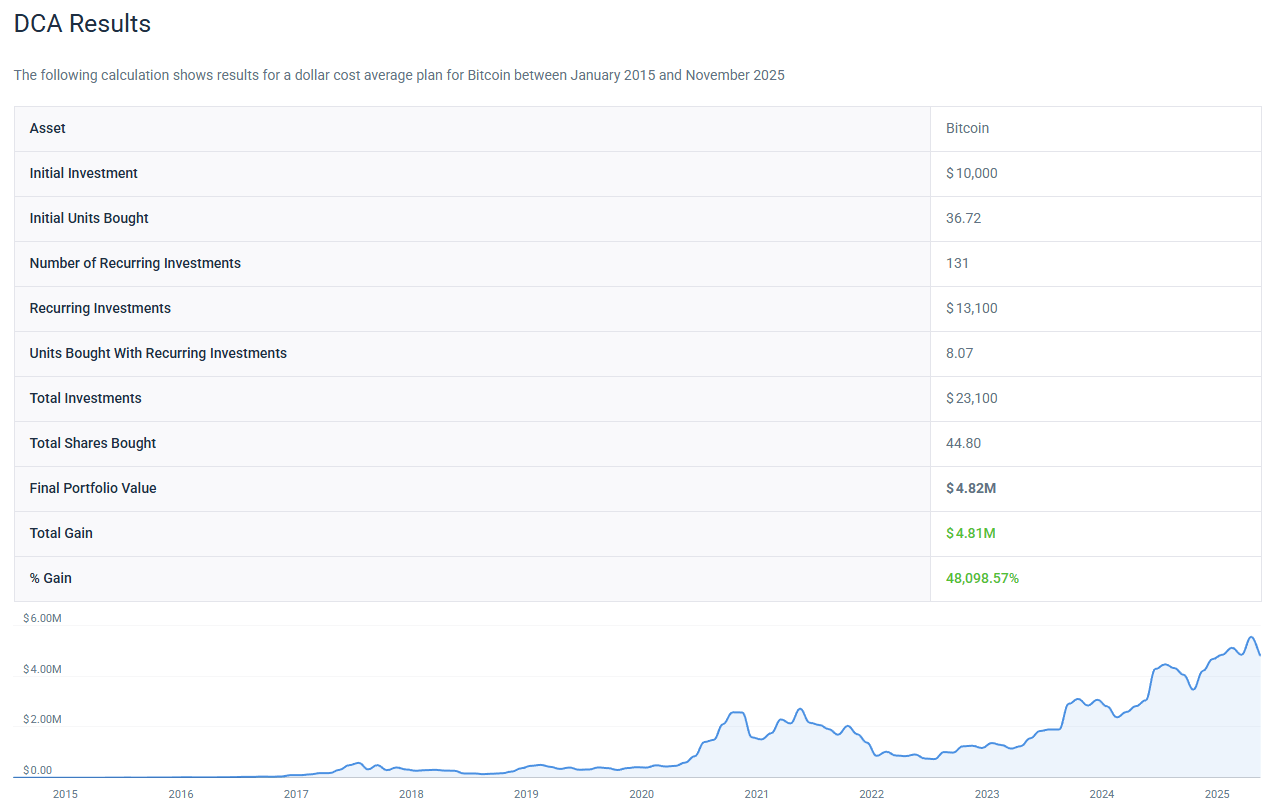
Results of a DCA plan that started with $1,000 in 2015 and continued with $100 monthly payments up to 2025.
The CoinCodex DCA calculator shows how this strategy performs across different time periods. It calculates your average entry price, the total Bitcoin accumulated, takes into account your recurring monthly payments, and calculates the ROI you would have achieved. Using the DCA calculator alongside the profit calculator allows you to compare the DCA strategy to a single one-time investment, which can be helpful when planning long-term exposure.