Crypto This Week: CPI, PPI and Key Economic Events to Watch as Bitcoin Eyes $69K
coinpedia.org
10 August 2026 04:40, UTC
This week brings a heavy mix of inflation, consumer and energy data that could influence risk assets and crypto prices. Bitcoin is approaching a key resistance zone, while $XRP and Ethereum analysts are watching different technical setups. Here’s what could matter most for the market.
Crypto This Week
The week is packed with economic releases, with inflation data likely to be the biggest catalyst:
Key Events This Week:
1. July Existing Home Sales data – Tuesday
2. OPEC Monthly Report – Wednesday
3. July CPI Inflation data – Wednesday
4. July PPI Inflation data – Thursday
5. July Retail Sales data – Friday
6. August MI Consumer Sentiment data – Friday
It's a big week…
— The Kobeissi Letter (@KobeissiLetter) August 9, 2026
Know when your coins move
Alerts, real-time prices, and market news — all in one app
4.8 based on 40K reviews in the App Store and Google Play
July Existing Home Sales — Tuesday: Strong figures could show economic resilience but weaken rate-cut bets. Softer results may lift expectations for easier policy and support risk assets.
OPEC Monthly Report — Wednesday: Production and demand forecasts will shape oil-market expectations. Higher crude prices could fuel inflation, while weaker demand may ease price pressures.
July CPI Inflation — Wednesday: The week’s biggest catalyst. Cooler inflation could boost Bitcoin and other risk assets, while a hotter reading may trigger selling.
July PPI Inflation — Thursday: Shows price pressure at the producer level. An unexpected jump could revive inflation fears and keep borrowing costs elevated.
July Retail Sales — Friday: Strong spending would signal a resilient consumer but could limit expectations for aggressive cuts. Weak figures may raise slowdown fears while strengthening easing bets.
August Michigan Consumer Sentiment — Friday: Offers a snapshot of household confidence and inflation expectations. A sharp decline could point to weaker economic activity ahead.
The CPI and PPI figures will be especially important because they could influence expectations around interest rates and broader risk appetite.
Bitcoin Position Right Now: Will it hit $68K?
Bitcoin has pushed toward $64,000, with the $68,000-$70,000 area now seen as the next major zone to watch.
One analyst pointed out that the current move may not be the start of a fresh bull run. Instead, he expects Bitcoin could make one more push toward $69,000 before a deeper correction begins. His projected path is $64K, $69K, $61K, followed by potential moves toward $57K, $53K, $49K and eventually $44K.
🚨 THIS SETUP IS GETTING UGLY
$BTC has already pushed into $64K, with $68K-$70K FVG now in sight
But this move doesn't look like start of a new bull run$BTC looks like it's building one final squeeze before real flush begins
Bearish signal: Rejection near $69,000 and break below $61,000
He further expects around 60 days of accumulation before a possible recovery toward $55,000. He also points to previous calls involving Bitcoin’s $126K cycle top in 2025, the $96K, $60K and $83K, $59K sell-offs, and the latest roughly 10% S&P 500 correction.
Will $XRP Revive?
Some $XRP analysts Julia Liberte and Dandelion said the token is following a structure similar to its 2017 cycle. Their roadmap starts with a move from $1.10 toward $0.97, followed by $1.80, then $2.70-$3.20. If the pattern continues, they see a possible move toward $6.50 and eventually $13.
$XRP is repeating the exact same trendline from 2017.
History is repeating itself.
Right before the 70,000% explosion.
The path to the next bull run:
Scenario 1: (AUG-SEP) $1.10 → $0.97 → $1.80
Scenario 2: (NOV-DEC) $1.80 → $2.70 → $3.20
Scenario 3: (JAN-FEB)… pic.twitter.com/e4JhRDAykp
— Julia (@Julia_Liberte) August 9, 2026
Hence another successful support retest could trigger a larger expansion, although these remain technical projections rather than guaranteed price targets.
Ethereum Gets Two Monthly Buy Signs
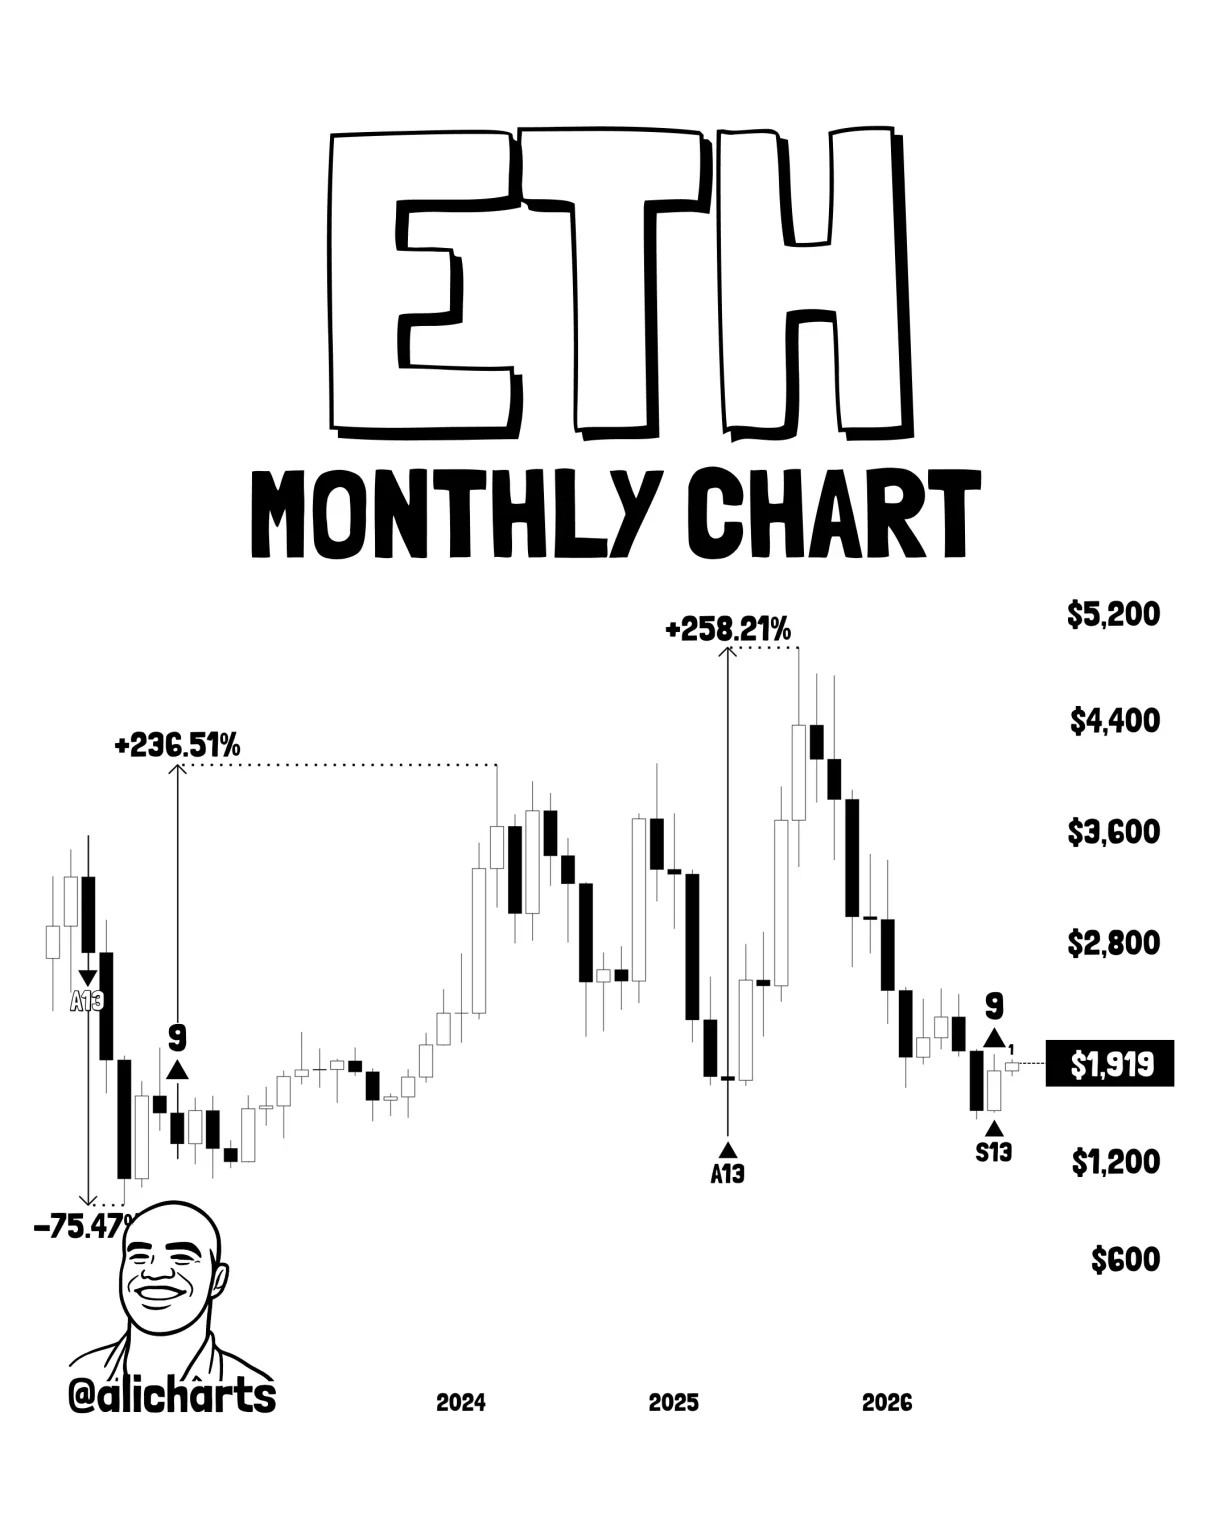
Ethereum is also attracting attention after On-chain analyst Ali Martinez revealed two TD Sequential buy Indicators on its monthly chart, a black 9 and an S13.
He pointed to previous Cues, including a 236% rise after the September 2022 buy trigger and a 258% gain following the April 2025. If the latest signs are validated, he sees Ethereum potentially moving toward $3,000.
Other Events
Markets are also waiting for the Iran deal that the US said was coming last week. The agreement has still not been announced, leaving geopolitics as another factor traders will monitor alongside this week’s economic data.

 coinpedia.org