Ethereum price remained trapped between $2,400 support and $2,500 resistance on Sept. 1, with weak trend strength and fading momentum raising the risk of another liquidity-driven pullback.
According to data from crypto.news, Ethereum ($ETH) price was trading near $2,460 at press time, little changed over the previous 24 hours and down about 1% over the past week. The token had retreated from an Aug. 27 high near $2,564 after buyers failed to extend its late-August breakout.
Trading activity has also cooled. CoinGecko data showed that Ethereum’s 24-hour volume had fallen by about 21% to approximately $11.35 billion, indicating lower participation as the price consolidated.
Know when your coins move
Alerts, real-time prices, and market news — all in one app
4.8 based on 40K reviews in the App Store and Google Play
$ETH remains caught between support around $2,400 and resistance extending from $2,500 to $2,565. A break from that range could determine whether the August rally resumes or gives way to a deeper correction.
Ethereum price loses momentum below $2,500
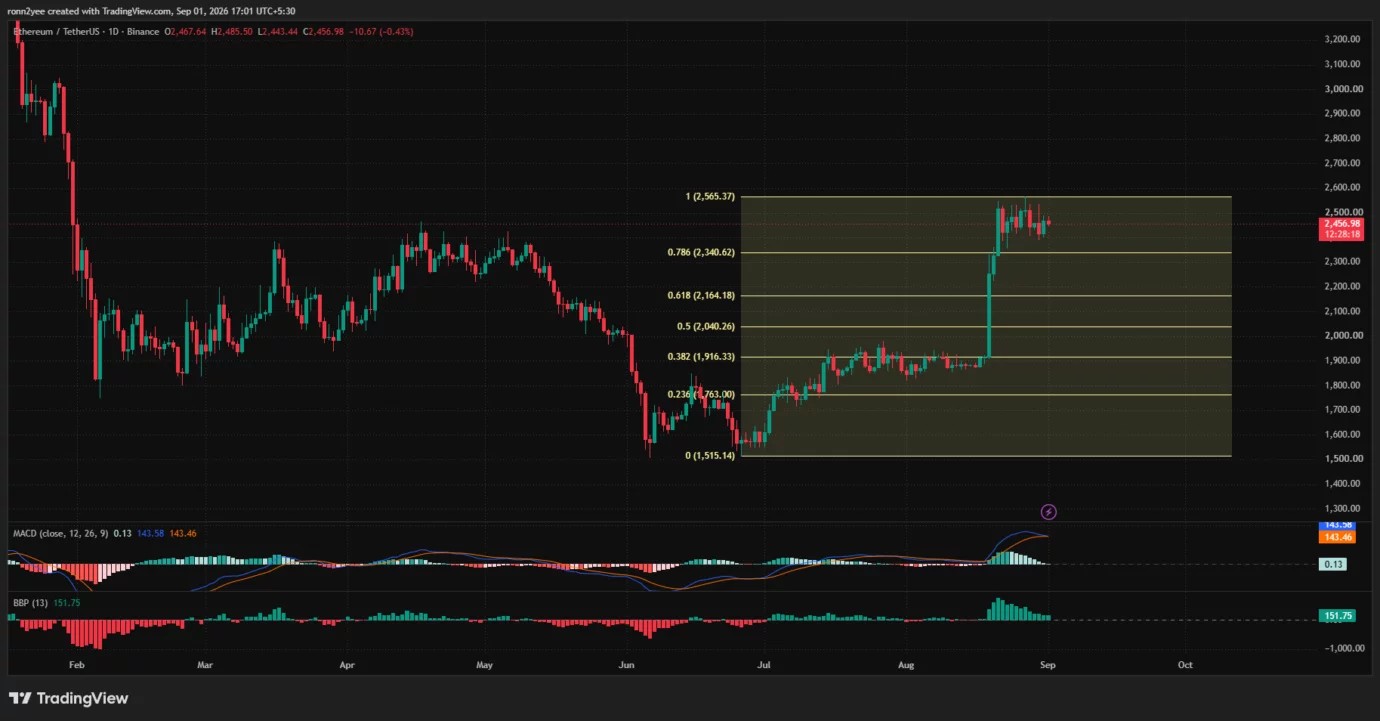
The daily chart shows Ethereum consolidating near the upper end of the advance from its June low of $1,515 to the August high of $2,565.
$ETH remains above the 78.6% Fibonacci retracement level at $2,340, which now serves as the main higher-timeframe support. Holding above that level would preserve most of the structure created by the August breakout.
However, momentum has weakened considerably. The daily moving average convergence divergence indicator is close to producing a bearish crossover. The MACD line stands at 143.58, only slightly above the signal line at 143.46, while its histogram has narrowed to almost zero.
Bull-bear power remains positive at 151.75, suggesting buyers have not lost full control. Its bars have nevertheless declined since the initial breakout, showing that bullish pressure is fading as $ETH struggles to clear $2,500.
A daily close above $2,565 would invalidate the short-term consolidation and open a path toward $2,600. Continued rejection beneath that area would leave $2,340 exposed, followed by the 61.8% Fibonacci level at $2,164.
4-hour indicators point to range-bound trading
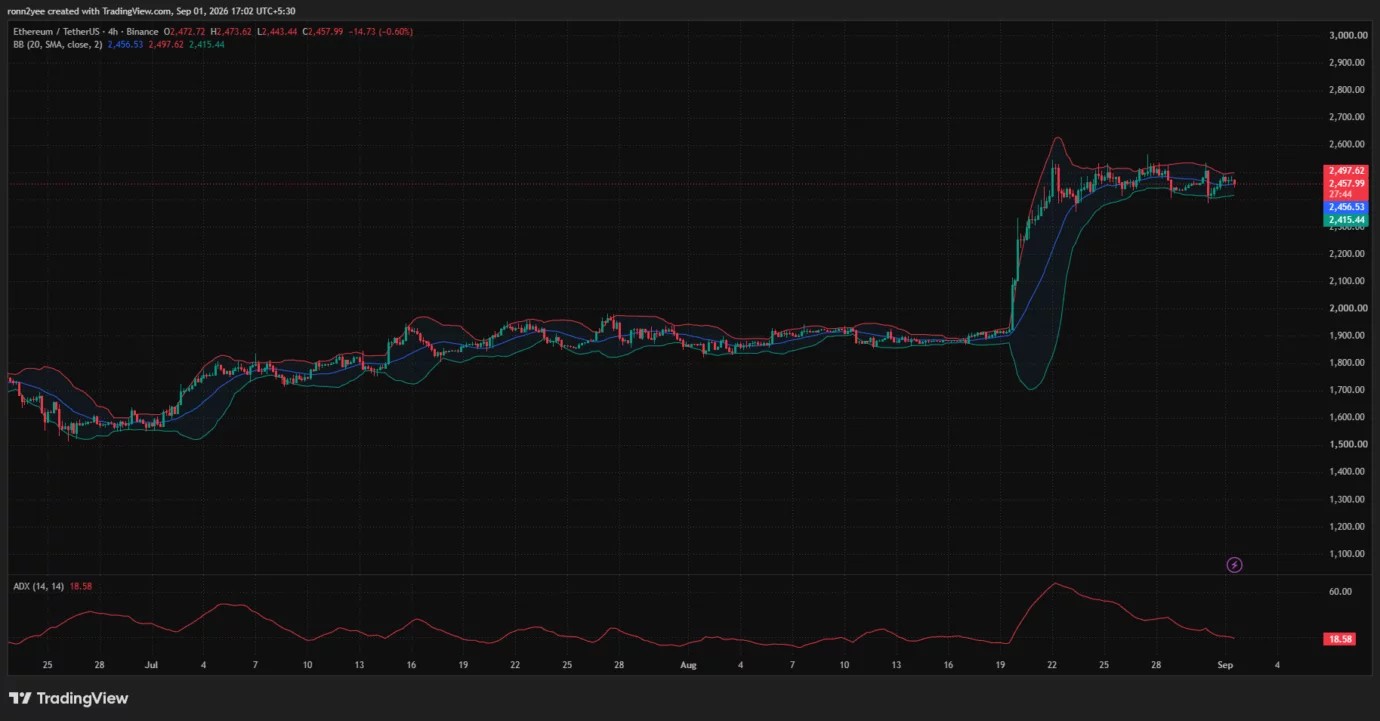
Ethereum’s 4-hour chart provides a more neutral outlook. $ETH is trading almost directly on the Bollinger Bands’ middle line at $2,456.53, reflecting a balance between buyers and sellers.
The upper band sits at $2,497.62, making $2,500 the first resistance that bulls must reclaim. The lower band at $2,415.44 aligns with the broader $2,400 support area.
The bands have narrowed after expanding sharply during the Aug. 20 breakout. Such compression often precedes a larger move, although it does not indicate which direction the price will take.
The average directional index has fallen to 18.58 from above 60 following the rally. An ADX reading below 20 generally signals that the market lacks a strong directional trend, supporting the case for continued consolidation until $ETH moves outside the Bollinger Bands.
Crypto trader Daan Crypto Trades said $ETH was trading in a tight area between its weekly 200-day simple and exponential moving averages and a horizontal price level.
$ETH Still sitting in this really tight area between its Weekly 200MA/EMA & Horizontal level.
Pretty sure we'll see this move away from this area soon.
$2.4K & $2.5K levels to watch on the daily closes. The past ~11 days have been closing in between those. pic.twitter.com/Dnj59AEiH0
— Daan Crypto Trades (@DaanCrypto) September 1, 2026
The analyst identified $2,400 and $2,500 as the levels to monitor on daily closes, noting that Ethereum has spent roughly 11 days between them. Under that setup, a sustained close above $2,500 would favor buyers, while a loss of $2,400 would weaken the breakout structure.
Liquidation clusters surround Ethereum price
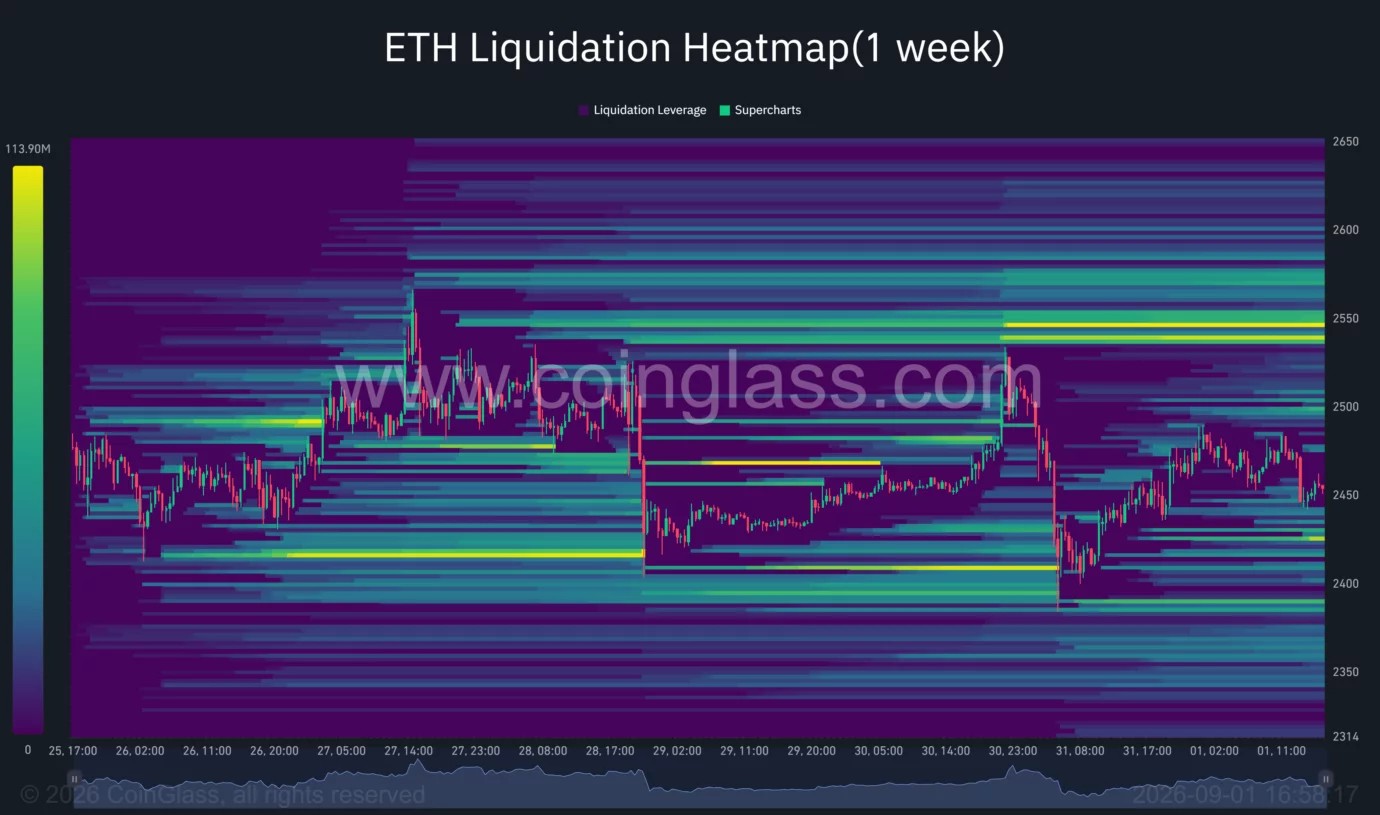
CoinGlass’s one-week liquidation heatmap shows leveraged positions building on both sides of Ethereum’s current price.
Ethereum liquidation heatmap | Source: CoinGlass
The largest nearby overhead concentration appears between approximately $2,540 and $2,550. A move into that area could force short positions to close, potentially accelerating an upside test of the $2,565 August high.
Additional liquidity rests around $2,495 to $2,505, reinforcing $2,500 as the first barrier.
On the downside, notable clusters appear around $2,420 to $2,410, followed by another concentration close to $2,390. A break below $2,400 could therefore trigger long liquidations and pull $ETH toward the lower liquidity zone.
Liquidation maps identify areas where leveraged positions may be forced to close, but they do not guarantee that the price will reach those levels.
Trader Gerla compared Ethereum’s current position with a former support zone that became resistance during the previous market cycle. The analyst said a repeat of that structure could produce more range trading and a sweep toward $1,900–$2,000 before a larger advance.
The comparison represents a long-term scenario rather than a confirmed target. $ETH must first lose $2,340 and $2,164 before the $2,000 area becomes a more immediate technical risk.
US Ethereum ETF inflows offer support
Demand through regulated US investment products remains a counterweight to the weak price momentum.
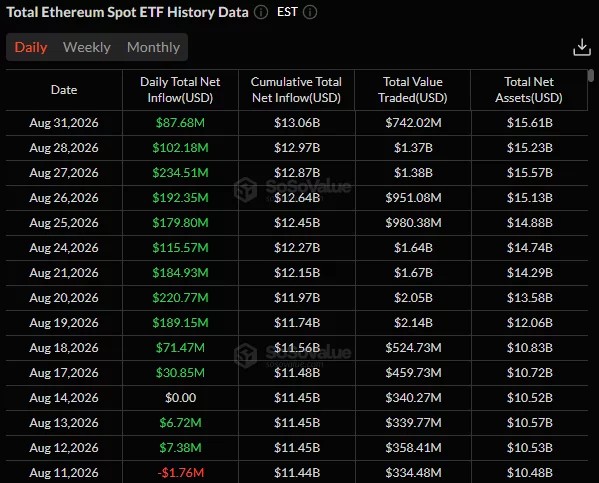
US spot Ethereum ETFs recorded $87.68 million in combined net inflows on Aug. 31, according to SoSoValue data. The session reportedly extended its positive flow streak to 11 trading days.
Source: SoSoValue
BlackRock’s iShares Ethereum Trust led the daily total with approximately $59.94 million, while the Grayscale Ethereum Mini Trust added about $13.50 million. The products collectively held approximately $15.61 billion in net assets, equal to 5.23% of Ethereum’s market capitalization.
Persistent ETF inflows suggest US investors are adding exposure despite Ethereum’s failure to move above $2,500. However, price confirmation remains absent while trading volume declines and momentum indicators flatten.
Ethereum’s next directional signal will likely come from a daily close outside the $2,400–$2,500 range. A close above the upper boundary would bring $2,550–$2,565 into focus, while a loss of $2,400 would expose $2,340 and increase the risk of a broader retracement.

 crypto.news