Ethereum (ETH) Breaks Above $1.9K: How Close Is the Push Toward $2K?
thenewscrypto.com
17 August 2026 18:02, UTC
Ethereum is trading around the $1.9K level.
$ETH has been forming a symmetrical triangle.
The largest altcoin, Ethereum ($ETH), is trading within the $1,903 range, with its daily volume reaching $4.58 billion. Also, the 24-hour trading range is between $1,867 and $1,903. The market has experienced $24.09 million in $ETH liquidations over the past 24 hours.
Moreover, the price has broken above and held the $1,750 low along with the nine-month downtrend for over a month. What is playing out since is a long and drawn-out bottoming process, the kind that shakes out the last believers before the real move develops.
Know when your coins move
Alerts, real-time prices, and market news — all in one app
4.8 based on 40K reviews in the App Store and Google Play
On the daily chart, $ETH has been forming a symmetrical triangle, the price moving sideways around the 50 EMA for nearly 30 days, building pressure as the range tightens. The closer price moves to the triangle’s apex, the more explosive the eventual breakout tends to be.
Recently, a rectangle breakout is already in motion. The asset consolidated between $1,865 and $1,892 before breaking above the upper resistance. That breakout is the short-term signal the daily pattern has been waiting for confirmation on.
$ETH’s Major Support and Resistance Levels
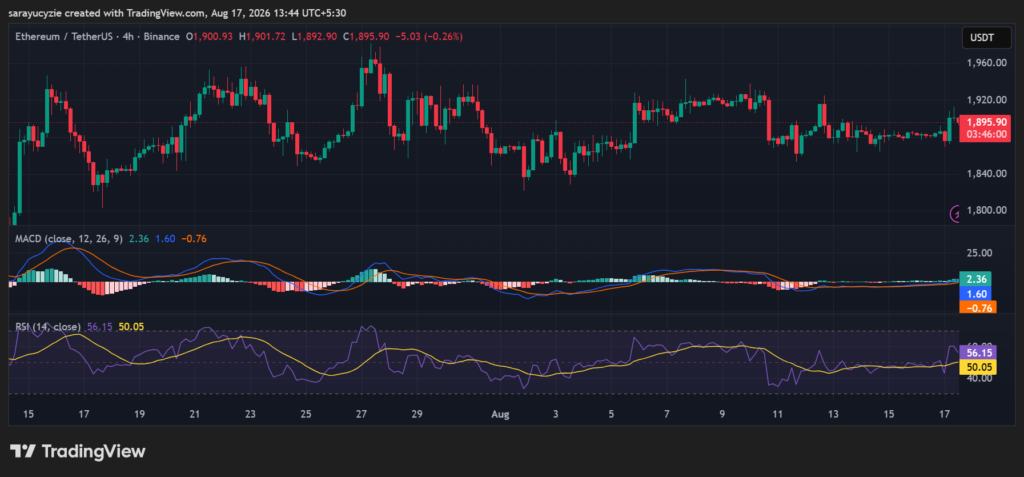
The 4-hour trading pattern shows that if it holds above $1,911 and stays, $1,925 would be the major chart target. The next crucial zone to be aimed at beyond that range is $2K. It could confirm the bottoming process is complete and the higher momentum is underway.
On the other hand, a drop into the $1.8K zone might test price. Assuming the downside correction deepens, the $ETH price could continue falling even lower, below the $1,821 level. This serves as a crucial area that decides whether the altcoin price stabilises or faces more losses.
Where is Ethereum’s Momentum Heading Next?
The Moving Average Convergence Divergence line is found above zero, and it has crossed above the slower moving average, confirming that short-term buying momentum has turned positive. The signal line is below zero, which shows that $ETH is emerging from a recent longer-term downtrend.
Notably, it is an early bullish reversal, with the MACD having completed a bullish crossover, leading the recovery. The overall momentum is transitioning, but short-term buyers have taken active control to push the momentum positive.
(Source: TradingView)
Ethereum’s daily Relative Strength Index (RSI) value is at 56.15, indicating a mildly bullish market with momentum slightly favouring buyers. They have a minor edge over sellers, but the trend is not overly aggressive. It sits below 70, and there is zero immediate risk of being overextended.
Furthermore, the reading in the mid-50s reflects steady price consolidation with the early stages of a developing uptrend. The buyers are in control, but the momentum is balanced and has plenty of runway left to move higher.

 thenewscrypto.com