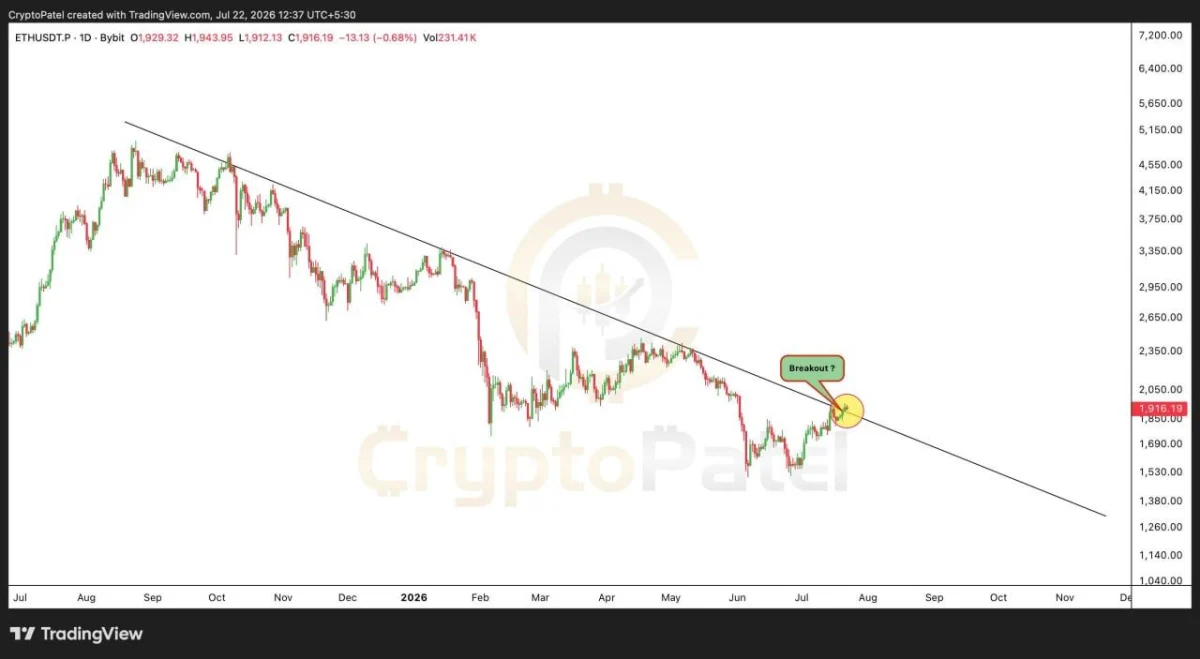
$ETH daily chart. Source: Crypto Patel/X
The breakout area around $1,850–$1,900 now needs to act as support. Holding it could open a recovery toward $2,350 and $2,950 before Ethereum challenges the larger $3,350–$3,500 resistance zone.
However, $3,500 remains a distant and conditional target. A daily close back below the broken trendline would weaken the breakout and increase the risk of another decline toward $1,700–$1,550.
$ETH/$BTC Breaks Its 11-Month Downtrend
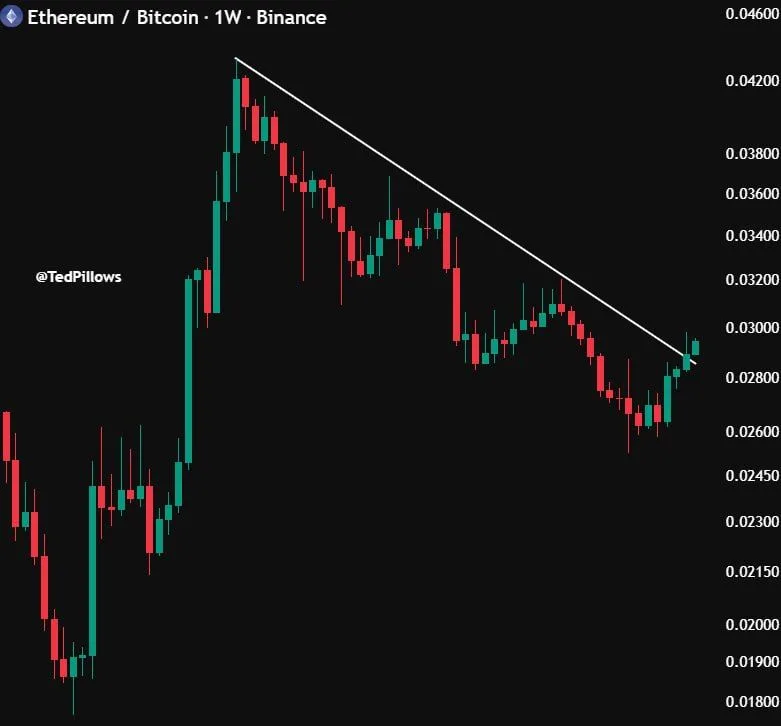
Ethereum has broken above an 11-month descending trendline against Bitcoin, according to analyst Ted. The move suggests $ETH may be entering a period of stronger relative performance after months of weakness.
$ETH/$BTC weekly chart. Source: Ted/X
The pair now needs to hold above the broken trendline and reclaim 0.03 $BTC to confirm the breakout. Continued strength could bring the 0.032 $BTC and 0.034 $BTC resistance levels into focus.
However, a weekly close back below 0.028 $BTC would weaken the setup. A deeper decline toward 0.026 $BTC would suggest the broader $ETH/$BTC downtrend remains active.

 coinpaper.com