Ethereum at a Crossroads: Decoding the Crucial ETH/USD Re-Test
coinpedia.org
20 July 2026 23:10, UTC
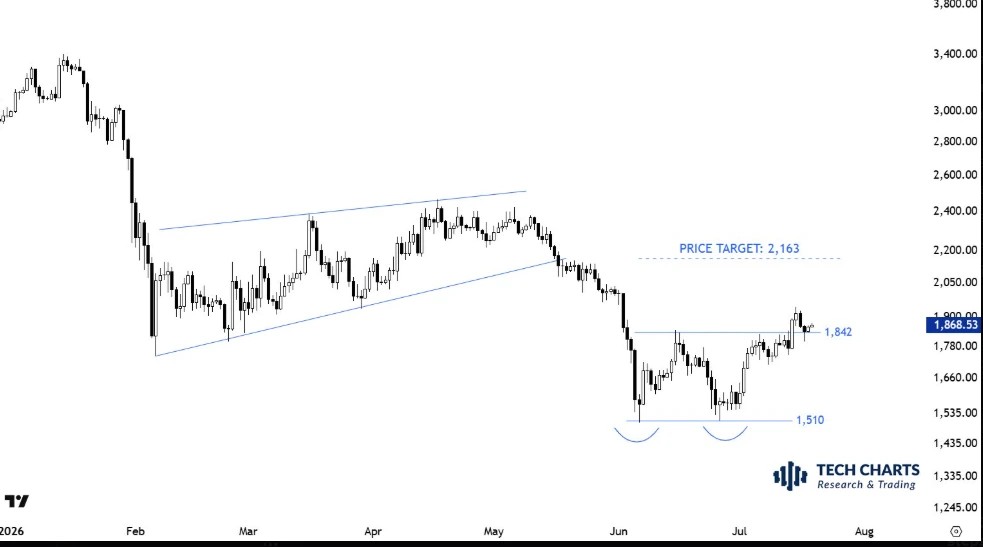
A week ago, Ethereum ($ETH) broke above its $1,842-$1,868 resistance line, flipping it into the new support line. Technical analysis on weekly time frames in a multi-month period suggested an uptrend to $2,163, with key resistance levels at $1,900 and $2,000.
Ethereum retesting a new support zone
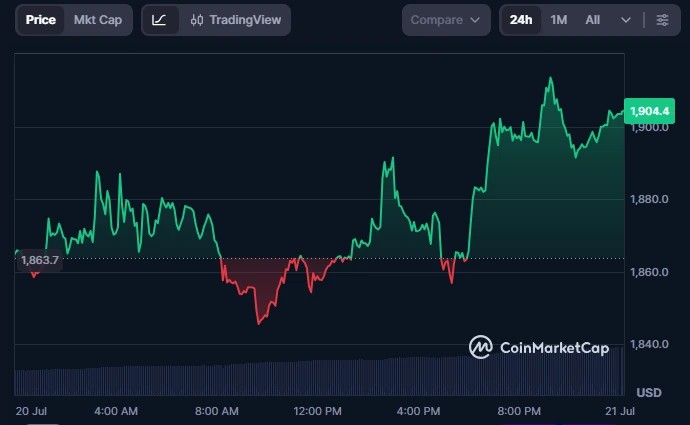
In the last 24 hours, Ethereum briefly pulled back below the support line, then once again recovered to trade above it. At press time, the price of $ETH was $1,904, as the coin gained 2.35% in that time period.
Know when your coins move
Alerts, real-time prices, and market news — all in one app
Point your phone camera to install
4.8 based on 40K reviews in the App Store and Google Play
Source: CoinMarketCap
If buyers outnumber sellers, they can defend this recovery, and we will consider the re-test complete. This would also lay reliable groundwork for a continuation in the upward trend. A weekly close above the support line would further validate market strength and the potential for its next macro leg upward.
Source: Tech Charts
What lies ahead
Should sell-side pressure persist, the retest might fail as price respects resistance or falls below it. Total invalidation of the above bullish trend would occur if prices drop to the $1,710-$1,750 range.
A longer-term bullish thesis was recently proposed by Bitmine Chairman Tom Lee, stating $ETH price could hit $12,000 once Bitcoin achieves $250,000. His theory also suggested similarities between Ethereum price and Amazon or Nvidia stocks right before they gained traction.
Supporting these predictions, include the network’s staking ratio recently rising to an all-time high of 35%, creating a supply squeeze. Additionally, Ethereum spot ETF flows have turned positive, indicating higher institutional demand for the coin.
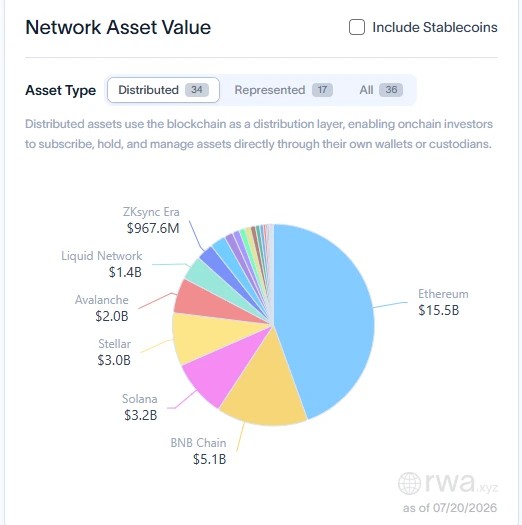
Source: rwa.xyz
The blockchain also continues to dominate the tokenized real-world asset (RWA) market, now hosting over $15 billion in distributed assets.

 coinpedia.org