
 en.cryptonomist.ch

As of July 20, 2026, the Ethereum price today sits at $1,865.94 — pressing against its daily pivot of $1,866.93 almost to the dollar. The market is at a decision point: the next move will either confirm recovery or expose this bounce as another failed breakout attempt.
Key takeaways
- Ethereum trades at $1,865.94, sitting almost exactly on its daily pivot of $1,866.93 as of July 20, 2026.
- Daily RSI at 58.68 signals upward momentum with room to run, while the MACD histogram expands positively at 10.45.
- The 200-day EMA at $2,239.22 remains a structural ceiling roughly 20% above current price.
- Bitcoin dominance at 56.43% and Fear & Greed Index at 29 create a non-permissive macro backdrop.
- Daily ATR of 62.83 means $60+ swings are normal, with S1 at $1,842.15 and R1 at $1,890.72 both reachable within a single session.
The broader crypto market offers little clarity. Total market capitalization stands at approximately $2.28 trillion with a 24-hour decline of roughly 0.47%, per CoinGecko. Bitcoin dominance has climbed to 56.43%, signaling that capital is consolidating in the market leader rather than rotating into altcoins. The Fear & Greed Index reads 29 — firmly in Fear territory. That combination of dominant $BTC, fearful sentiment, and flat altcoin flows creates a non-permissive macro environment for Ethereum. Any breakout attempt will need to fight against the current, not swim with it.
Daily Chart Structure
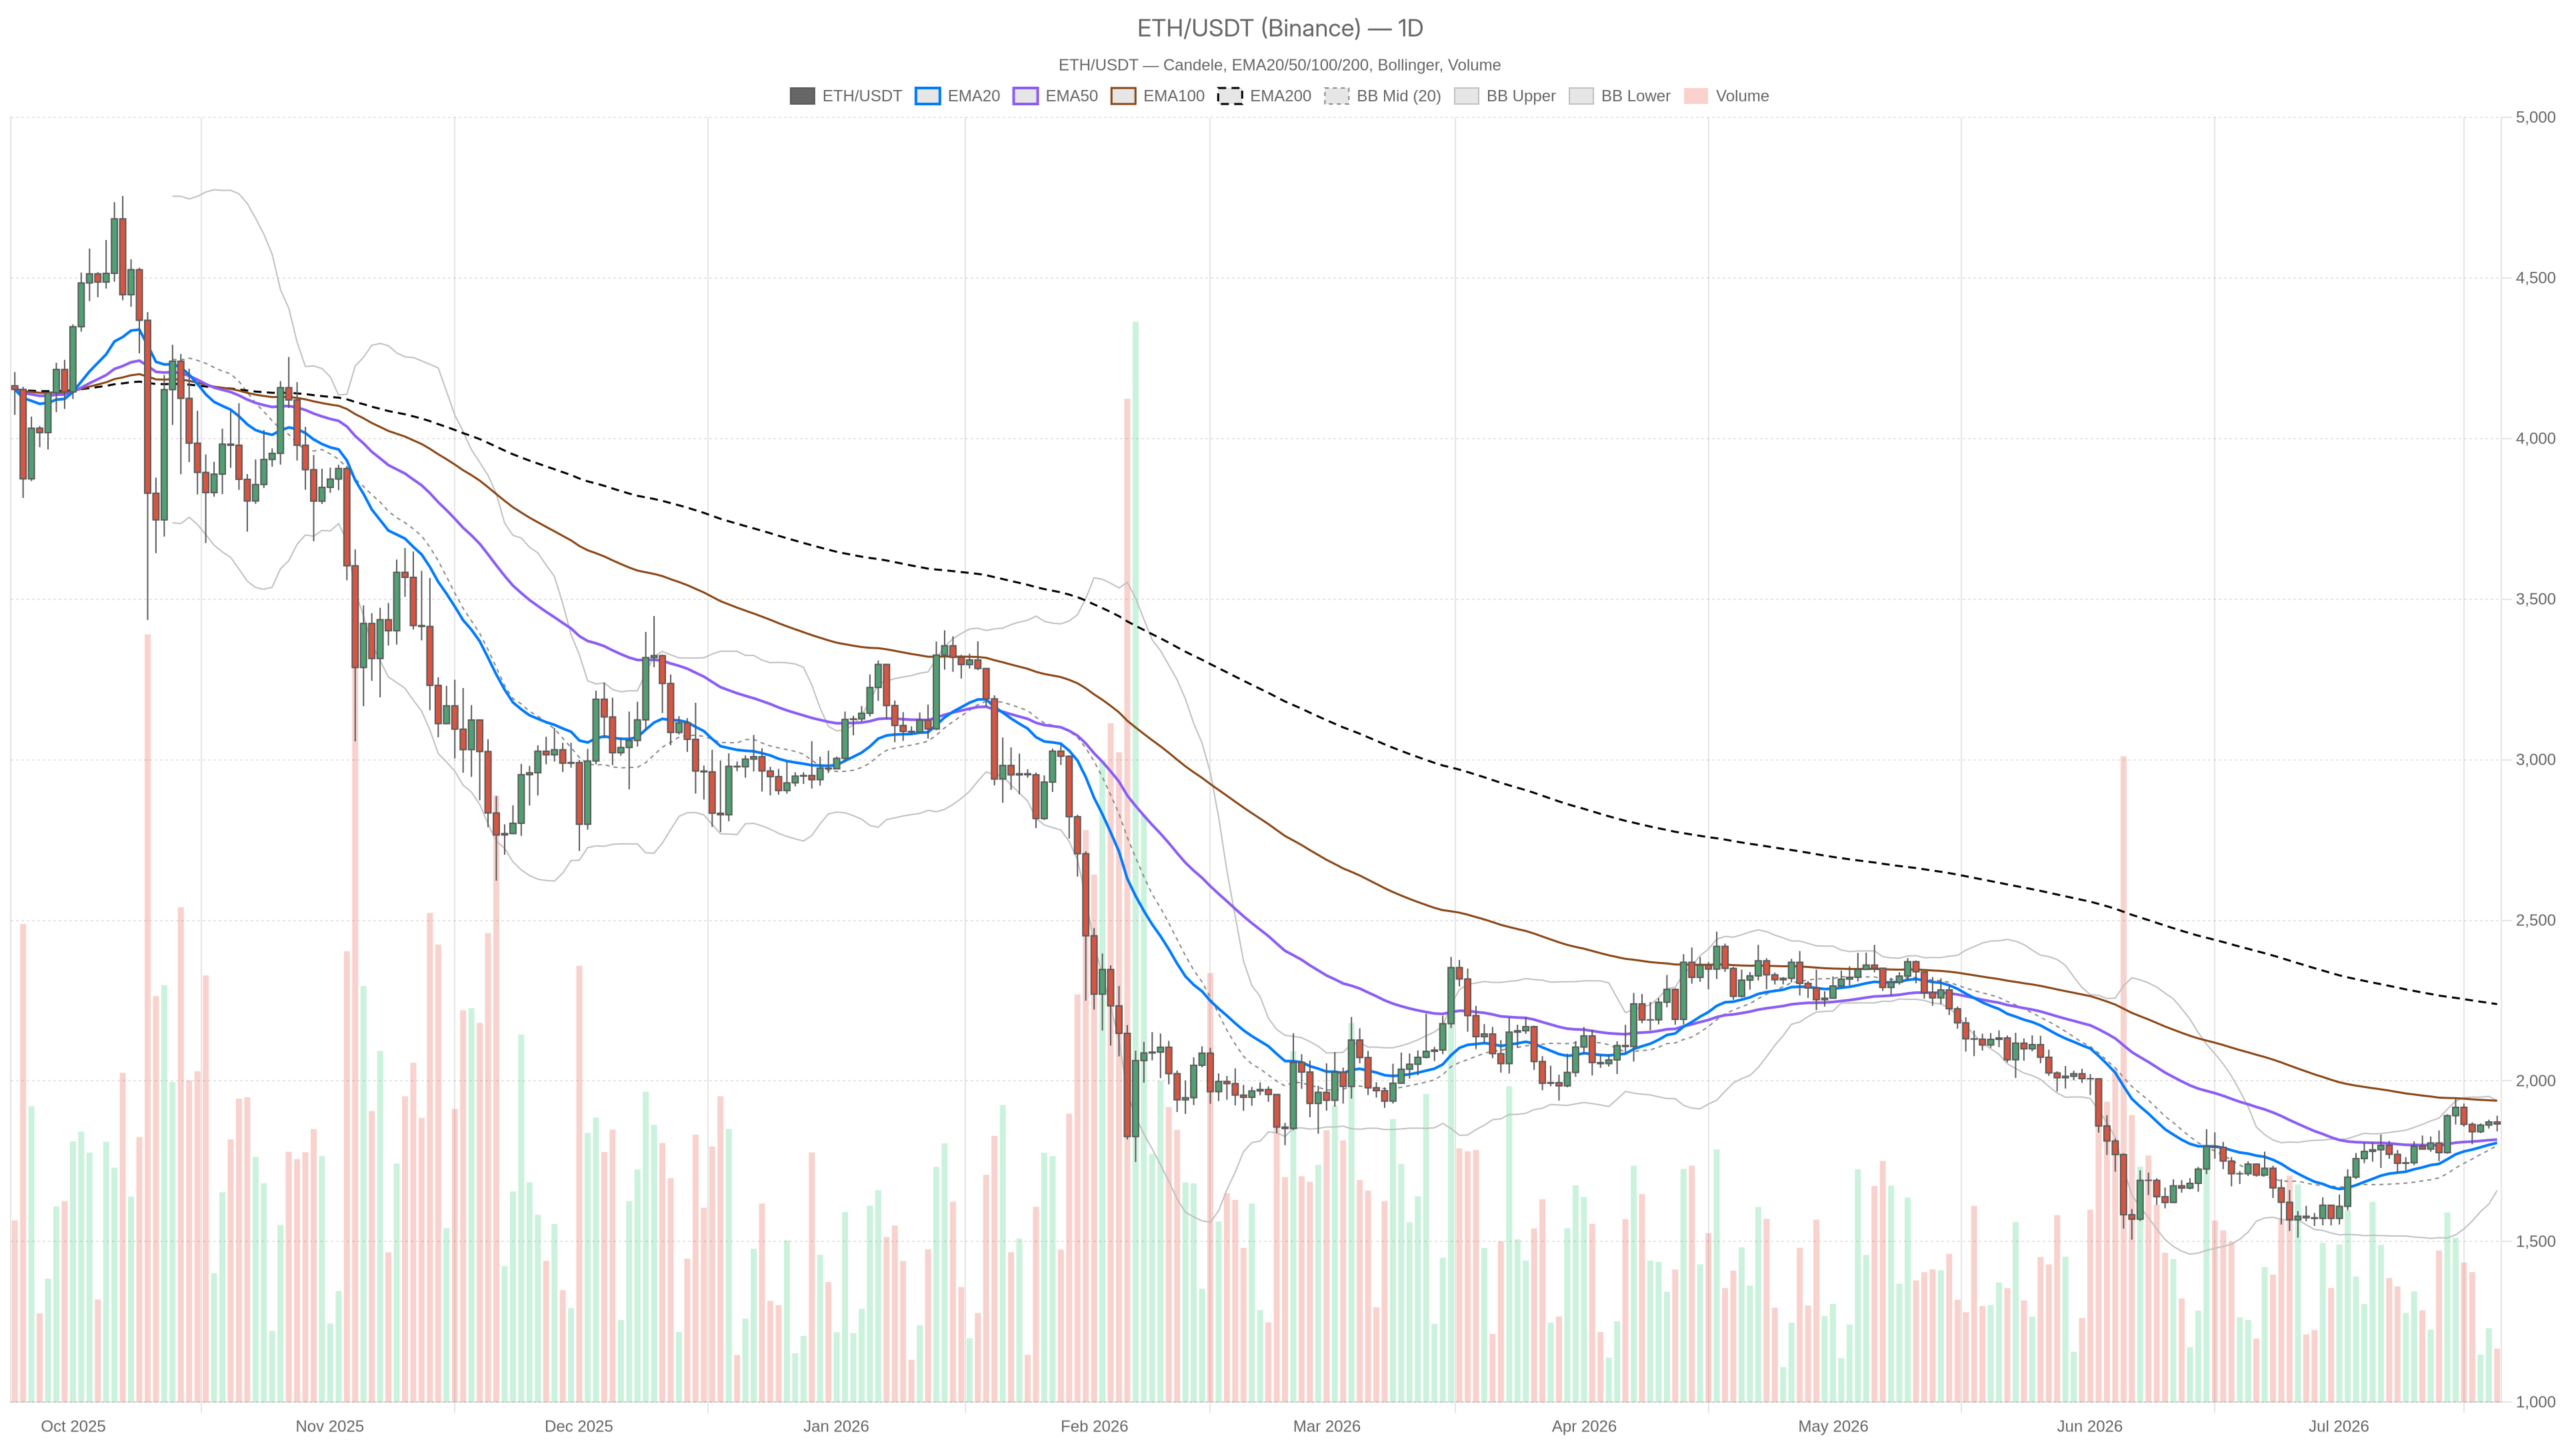
The daily chart shows a neutral regime with improving short-term structure but a macro ceiling far overhead. The Ethereum price today sits above both the 20-day EMA at $1,807.21 and the 50-day EMA at $1,817.54, and that spacing matters. Ethereum has reclaimed both moving averages, which are now acting as a rising support floor rather than overhead resistance. That is constructive. However, the 200-day EMA at $2,239.22 looms roughly 20% above current price. It is not a nearby target — it is a structural ceiling that defines the months-long macro bear trend.
The daily RSI at 58.68 is doing exactly what you want to see in a recovering asset: above the 50 midpoint, trending upward, but not yet in overbought territory. There is room to run before momentum becomes a problem. The daily MACD reinforces this — the MACD line at 38.28 sits above the signal line at 27.83, producing a positive histogram of 10.45. The crossover is established and the histogram is expanding, meaning momentum behind this move is not fading yet. That said, Ethereum has had several MACD recoveries in recent months that stalled before delivering meaningful follow-through.
Bollinger Bands on the daily frame put the midline at $1,798.98, the upper band at $1,938.96, and the lower band at $1,659. Price is currently in the upper half of the range, between the midline and the upper band — exactly where trending assets tend to trade. The upper band represents the near-term ceiling before things get statistically stretched. Moreover, the ATR of 62.83 gives a sense of daily volatility: moves of $60 to $65 in either direction are entirely normal, meaning both R1 at $1,890.72 and S1 at $1,842.15 are realistically reachable within a single session.
Hourly Structure: Deceptively Calm
The hourly chart reveals a bullish regime classification with fractionally bearish momentum, suggesting consolidation rather than reversal. The 1H MACD line is at -0.41, just below the signal line at 0.63, printing a negative histogram of -1.04. Price is bullish by regime classification, but momentum on the hour is fractionally bearish. This conflict often appears when a trend is consolidating rather than reversing — yet it also precedes breakdowns if buyers do not step in.
The 1H EMAs tell a cleaner story. The 20 EMA at $1,865.60, 50 EMA at $1,863.42, and 200 EMA at $1,845.92 are all stacked in ascending order beneath price. This is the textbook configuration for a healthy short-term uptrend. However, the 1H RSI at 50.62 is essentially neutral and has not picked a direction yet. The hourly Bollinger Bands are tight, spanning $1,852.63 to $1,880.41 with a midline at $1,866.52, and price is trading right at that midline. This is a market catching its breath, parked at a high-frequency equilibrium point.
The 15-Minute View: Entry Context Only
The 15-minute frame shows early signs of an intraday momentum shift as the MACD histogram turns positive. The MACD line is at -0.52, but the histogram has flipped positive to +1.28 while the signal line sits at -1.80. That histogram reversal on the short-term frame, while the line remains negative, hints at a very early potential shift in intraday momentum. The 15M RSI at 52.87 is consistent with mild positive bias. All three EMAs on this timeframe are stacked below price in ascending order, and the ATR of just 5.40 signals minimal short-term volatility — the market is compressing ahead of a move.
DeFi Activity and On-Chain Context
DeFi activity shows a sharp spike in Uniswap V3 fees but diverging trends across other protocols, offering a nuanced rather than clearly bullish signal. Uniswap V3 stands out with a 1-day fee change of +117.98% and a 7-day increase of +40.52%, according to DefiLlama data. That is a meaningful spike in DEX activity — sudden surges in on-chain volume often precede or accompany volatile price moves. On an Ethereum-native protocol, it could reflect increased positioning around current levels. In contrast, Curve DEX fees dropped 33.5% in 24 hours and 70.15% over the past week, while Fluid DEX fell 31.15% on the day. The divergence across protocols suggests activity is concentrating rather than expanding broadly.
The Bull Case
A bullish scenario requires a close above $1,890.72 with volume, targeting the upper Bollinger Band at $1,938.96. For Ethereum to mount a genuine continuation, the price needs to close above the daily R1 at $1,890.72 with conviction — and more importantly, hold it on a retest. The daily upper Bollinger Band at $1,938.96 is the next logical target if that happens. A push toward $1,940 would represent the kind of breakout that could attract momentum buyers sitting on the sidelines. For this scenario to hold, the 1H MACD needs to cross back into positive territory, and the Fear & Greed Index would ideally need to stabilize or tick higher. The DeFi activity surge on Uniswap V3 provides some supporting color — if it translates into broader Ethereum network demand, it becomes a secondary tailwind.
The Bear Case
Failure to hold the daily pivot at $1,866.93 on a closing basis would open the door to S1 at $1,842.15 and potentially invalidate the recovery thesis. The bearish scenario is more straightforward. If Ethereum fails to hold the daily pivot on a closing basis, it opens the door to a retest of S1 at $1,842.15 and then the 20-day EMA cluster around $1,807. A daily close below the 20 EMA would functionally invalidate the recovery and shift the narrative back to a range-bound grind. With $BTC dominance above 56% and market-wide sentiment stuck in Fear, the conditions for a sustained Ethereum rally are fragile. Any negative macro headline — or simply a lack of follow-through buyers — could trigger a swift pullback within the daily ATR band.
Positioning: What to Watch
Traders should wait for a daily close above $1,890 or below $1,842 before committing to a directional view, as the compression signals an imminent sharp move. The current setup offers a clean decision boundary. Ethereum at $1,866 is essentially sitting on its daily pivot. The daily bias is mildly constructive — EMA structure is improving, MACD momentum is positive, and RSI has room to expand. But the macro context is not supportive: dominant Bitcoin, fearful sentiment, and a 200-day EMA still 20% overhead. That overhead resistance alone should temper any aggressive positioning.
Traders need to be honest about the ATR reality: daily swings of $60+ are normal for Ethereum right now, meaning $1,842 support and $1,938 resistance are both within a single day’s range. The compression visible on the 15M and 1H frames typically resolves with a sharp move, not a slow grind. Moreover, the direction of that resolution — not the compression itself — is what matters. Waiting for a daily close above $1,890 or below $1,842 before committing to a directional view is a far more defensible approach. It beats anticipating the move before it happens. This is a market that rewards patience over conviction.
FAQ
What is Ethereum’s current price and why is it significant?
As of July 20, 2026, Ethereum trades at $1,865.94, sitting almost exactly on its daily pivot point of $1,866.93. This proximity to the pivot makes it a critical decision level — a break above signals recovery continuation, while a failure to hold opens the door to a retest of support at $1,842.15.
What are the key support and resistance levels for Ethereum right now?
Immediate resistance sits at the daily R1 of $1,890.72, followed by the upper Bollinger Band at $1,938.96. Support is found at S1 ($1,842.15) and the 20-day EMA cluster around $1,807. The 200-day EMA at $2,239.22 remains the macro ceiling, roughly 20% above the current price.
Is Ethereum’s trend bullish or bearish right now?
The short-term structure leans mildly bullish — price holds above the 20-day and 50-day EMAs, daily MACD is positive, and RSI at 58.68 still has room to expand. However, the macro context remains bearish, with the 200-day EMA far overhead and Bitcoin dominance above 56% limiting altcoin rotation.
What do on-chain metrics say about Ethereum demand?
Uniswap V3 fees surged 117.98% in 24 hours, signaling a spike in DEX activity that often correlates with volatile price moves. However, other protocols like Curve and Fluid saw fee declines, suggesting activity is concentrating rather than broadening — a nuanced rather than clearly bullish signal.
Disclaimer: This article is for informational purposes only and does not constitute financial advice, an investment recommendation, or a solicitation to buy or sell any financial instrument or cryptocurrency. The analysis provided is not indicative of future results. Investing in crypto assets and financial markets carries a high risk of capital loss. Always do your own research (DYOR) and consult a qualified financial advisor before making any decision.
Article produced with the assistance of artificial intelligence and reviewed by the editorial team.