Ethereum to $2,163 Roadmap: Analyzing Double Bottom Pattern Found by Aksel Kibar
u.today
19 July 2026 16:44, UTC
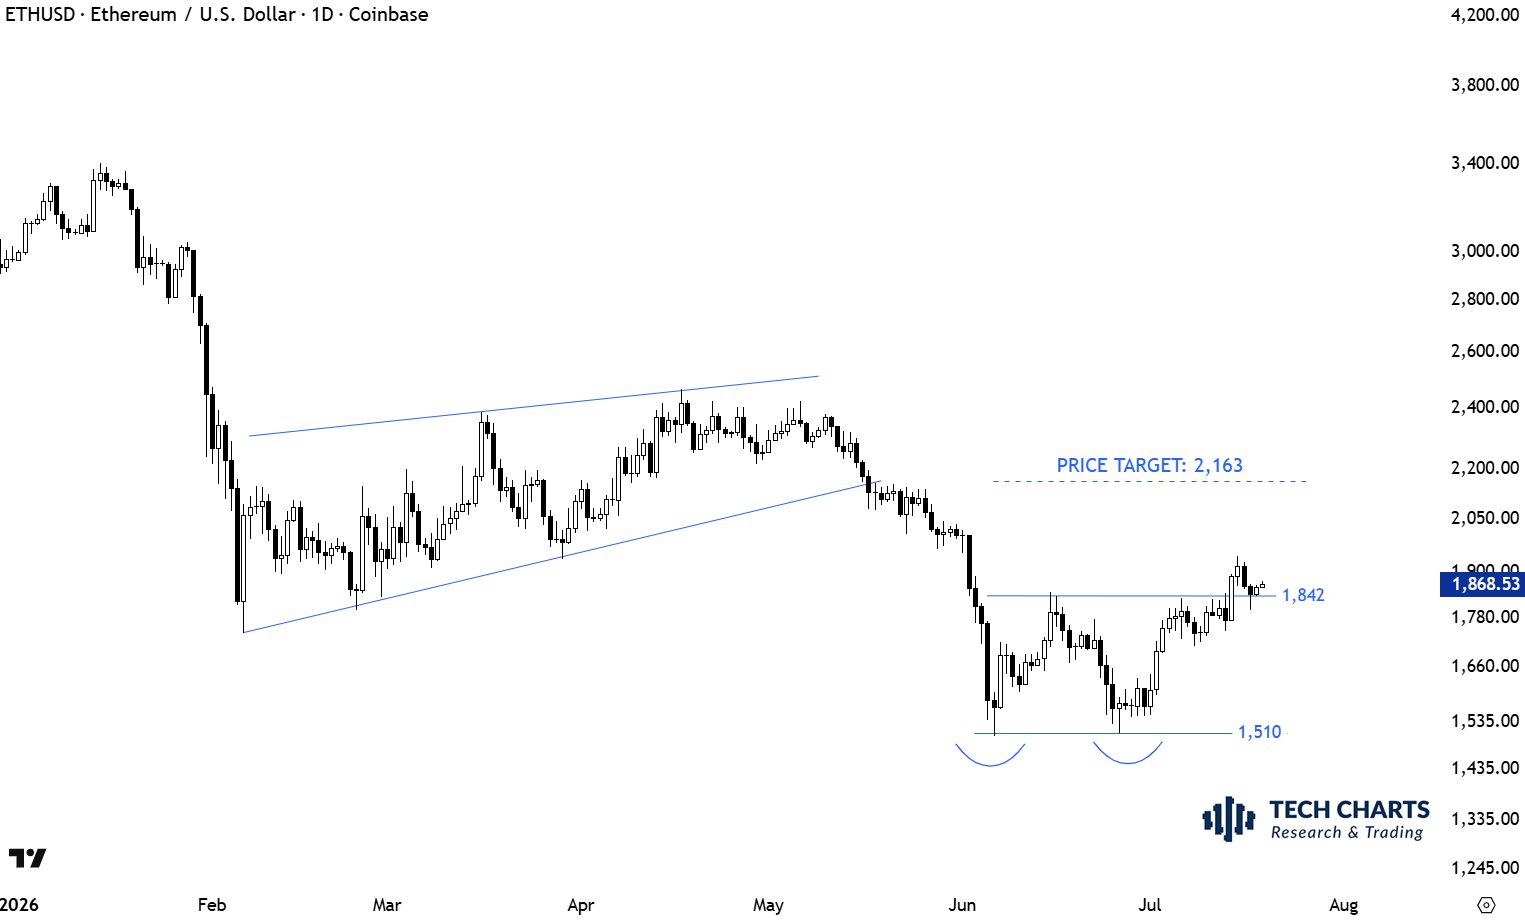
Tech Charts analyst Aksel Kibar presented a mathematical roadmap for the Ethereum move toward $2,163 based on a double-bottom pattern as the attempt to consolidate above the key technical level of $1,842 has once again divided the market into two camps.
Still, the chart's attractive geometry has not convinced the analyst himself either, as Kibar considers the current breakout local and refuses to buy Ethereum until its price proves its stability above the psychological barrier of $2,000.
Breakout or bull trap? Deciphering the scenarios for the path to $2,163
The double-bottom reversal pattern in question emerged after Ethereum twice found solid ground near $1,510 in June and July. On both occasions, buyers immediately bought the dip and formed matching lows. This prolonged battle for a foothold eventually ended successfully with an impulsive breakout above the pattern's neckline at $1,842.
Know when your coins move
Alerts, real-time prices, and market news — all in one app
Point your phone camera to install
4.8 based on 40K reviews in the App Store and Google Play
Fresh Ethereum ($ETH) price outlook by Aksel Kibar, Source: Aksel Kibar via X
Now, at $1,868.53 per $ETH, where the altcoin is attempting to consolidate and turn yesterday's resistance into reliable support, the current price setup creates two possible scenarios:
Bull case: If buyers hold Ethereum above $1,842 and turn the former resistance level into support, the asset could overcome the psychological barrier of $2,000 and move toward its main technical target of $2,163.
Bear case: If Ethereum fails to hold above $1,842 and closes the week below the pattern's neckline, the breakout would lose its validity and could turn into a bull trap. In this scenario, the price may return to its previous range and remain vulnerable to another test of lower support levels.
At first glance, the market appears to have produced an ideal entry point, especially considering that Ether is still trading significantly below its average price over the past year. However, retail enthusiasm is once again colliding with the cold-blooded caution of institutional capital.
Not for me at this stage. I'm looking for signs of initial strength. This can become part of a larger scale bottom.
— Aksel Kibar, CMT (@TechCharts) July 19, 2026
When asked whether it made sense to accumulate the asset at a discount below its annual moving average, Kibar replied that this trade was not for him at this stage, as he is looking for signs of initial strength, while the current move may represent only a small part of a much larger, global bottoming process.
A local breakout represents only a victory in one individual battle, while Ethereum's broader trend remains fragile and technically weak below its annual moving average. So, Kibar is deliberately accepting the possibility of missing part of the upside in exchange for entering later, once the asset demonstrates sustained strength and its macro structure begins to improve.
This makes buying $ETH here a risk of having capital locked in a prolonged and unpredictable sideways market.
In this context, the validity of the reversal will only become clearer after the next weekly close, which should determine whether the breakout is developing into a broader trend change or remains a local move within a larger bottoming process.

 u.today