The first downside level sits near $1,770, where buyers could attempt to defend the recent structure. A clear break below that support would shift attention toward $1,700, which represents the next major target in the bearish scenario.
However, the sell setup still requires confirmation through rejection and continued downside movement. A decisive breakout above the channel would invalidate the immediate correction case and suggest buyers remain in control.
Ethereum Rally Could Turn Into a Liquidity Trap
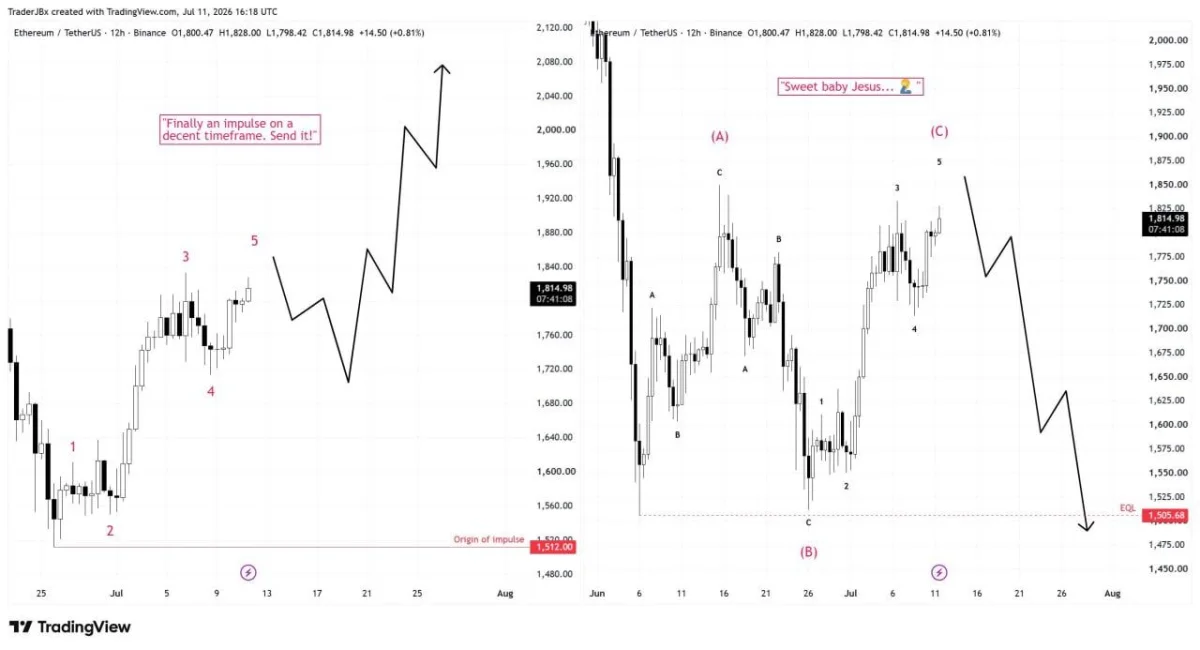
Ethereum’s rebound from the June 26 low looks impulsive on the 12-hour chart, but the wider structure leaves room for one final move lower. Analyst TraderJBx expects $ETH could first sweep liquidity above recent highs before reversing toward the equal lows near $1,505.
$ETH 12-hour chart. Source: TraderJBx/X
The short-term chart shows a five-wave advance from the late-June bottom, which normally supports continued upside after a pullback. Under that scenario, $ETH could retrace toward the $1,700-$1,760 region before extending above $2,000.
However, the broader chart presents a more bearish interpretation. The June 6 and June 26 lows formed near the same level, while the surrounding moves resemble corrective ABC structures, raising the possibility of an inverted flat correction.
In that case, $ETH could push above the recent $1,850 area to collect liquidity and attract late buyers before turning lower. A rejection after that sweep would put $1,750 and $1,600 back in focus, followed by the equal-lows zone near $1,505.
A sustained move above $2,000 would weaken the bearish scenario and support the case for a larger relief rally. Until then, the current advance may be a temporary liquidity move rather than the start of a confirmed uptrend.

 coinpaper.com