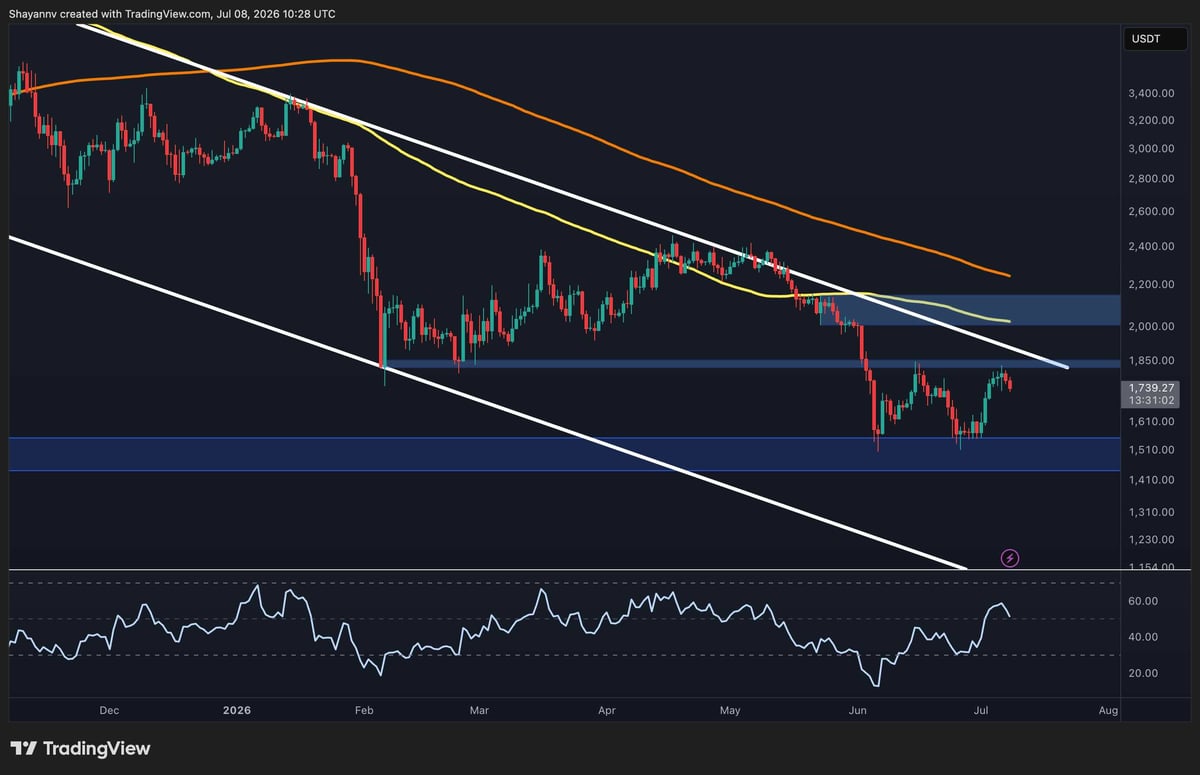
Adding to the bearish higher-timeframe picture, the price continues to trade below both the 100-day and 200-day moving averages, with the 200-day MA positioned considerably higher near the $2.2K area. This indicates that the broader trend remains bearish despite the recent recovery.
A decisive daily close above the $1.85K resistance could trigger a move toward the next supply zone around $2K to $2.2K, where the moving averages are also located. Until then, the current advance appears to be a recovery within a larger downtrend rather than a confirmed trend reversal. On the downside, losing the $1.5K support would expose the market to a much deeper decline and an overextension of the bearish trend.
$ETH/USDT 4-Hour Chart
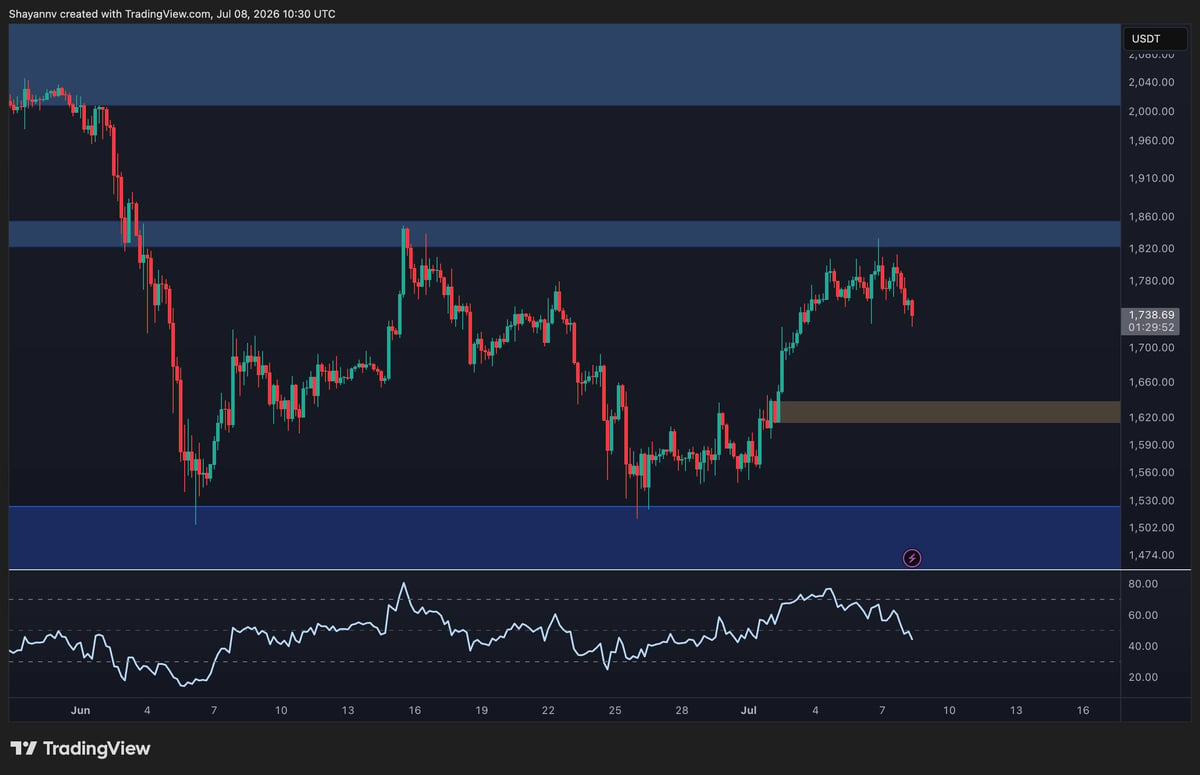
The 4-hour chart highlights improving short-term market structure following the strong impulsive rally from the $1.5K region. $ETH successfully reclaimed the previous short-term highs around $1.6K, which now acts as bullish order block support following the breakout.
The latest price action shows Ethereum consolidating below the $1.85K resistance zone after failing to extend higher. Recent candles indicate mild profit-taking, while the RSI has cooled from overbought conditions and has fallen back toward the midline, suggesting bullish momentum has weakened in the short term without completely disappearing.
As long as the price holds above the $1.65K order block, the current pullback appears to be a healthy correction within the ongoing recovery. A successful breakout above $1.85K would likely open the path toward the psychological $2K region.
However, failure to defend $1.65K could shift momentum back in favor of sellers and increase the likelihood of another test of the $1.5K support area.
Sentiment Analysis
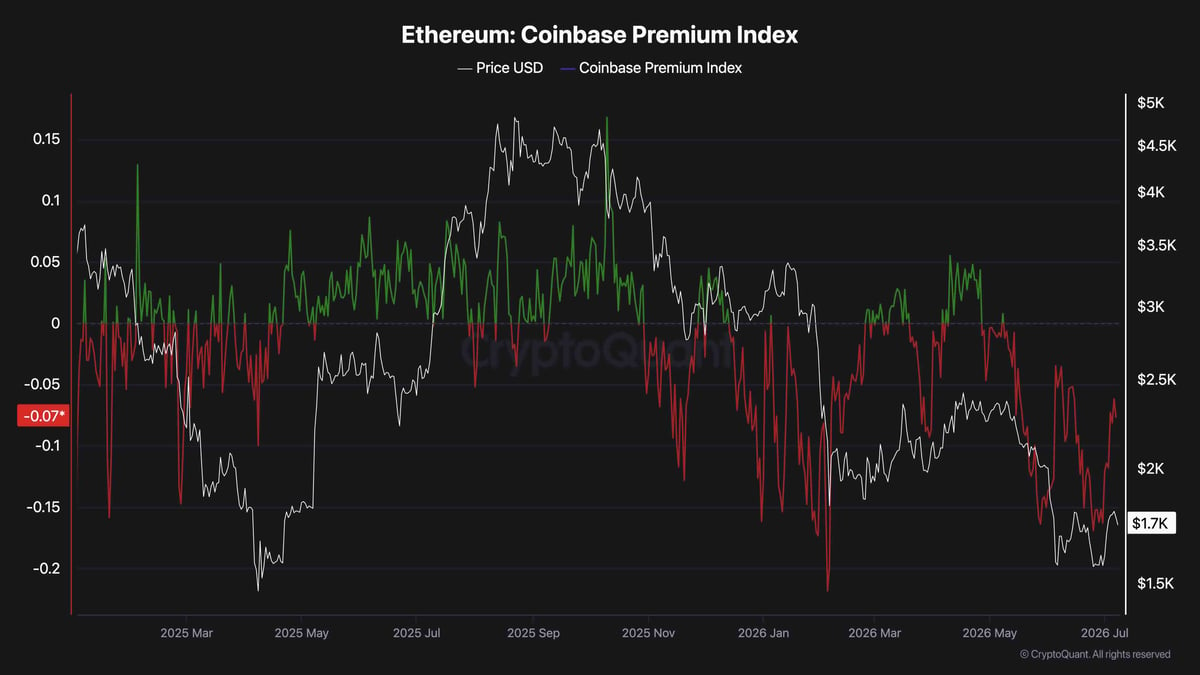
The Coinbase Premium Index continues to provide a cautious backdrop. The indicator remains below the neutral zero line, with the latest reading around -0.07, indicating that $ETH is still trading at a discount on Coinbase relative to other major exchanges.
Historically, sustained positive readings have reflected stronger buying activity from U.S.-based institutional participants. In contrast, the current negative premium suggests institutional demand remains relatively subdued despite Ethereum’s recent rebound.
The chart also shows repeated failed attempts to establish a lasting positive premium throughout recent months, implying that rallies have generally lacked consistent institutional accumulation. While the latest recovery in the index hints at improving sentiment, it has yet to reclaim positive territory, making it difficult to argue that large U.S. buyers have returned in force.
For the broader recovery to gain greater conviction, a breakout above the $1.85K resistance accompanied by the Coinbase Premium Index moving back into positive territory would provide stronger confirmation that institutional demand is beginning to support the advance. Until then, Ethereum’s recovery appears constructive but remains technically vulnerable to renewed selling pressure.

 cryptopotato.com




