
 invezz.com

Ethereum ($ETH) staged a notable recovery over the past week, briefly climbing above the $1,800 mark as broader cryptocurrency market sentiment improved.
The second-largest cryptocurrency has gained roughly 10% during the period, fueled by renewed buying activity across derivatives markets.
A key driver behind the rebound has been the turnaround in Ethereum's Net Taker Volume, an indicator that measures the difference between buying and selling activity in $ETH perpetual futures markets.
Positive readings suggest buyers are dominating trading activity, while negative values indicate stronger selling pressure.
However, it has failed to maintain its price above $1,800 and could record further losses in the near term.
Ethereum's previous decline from May through late June coincided with the metric turning negative.
Since the indicator flipped back into positive territory on June 28, $ETH has rallied nearly 14%, highlighting a shift in short-term market sentiment.
Derivatives market shows cautious optimism
Despite the recent price recovery, derivatives data suggest traders are not aggressively increasing leveraged positions.
Ethereum's Open Interest (OI) has remained relatively unchanged throughout the rally, while the Estimated Leverage Ratio—which compares futures open interest with exchange reserves—has yet to recover meaningfully following its decline in June.
This indicates that Ethereum's latest rally has been driven primarily by spot demand rather than excessive leverage.
As a result, the surge appears less vulnerable to sharp liquidation-driven corrections.
However, the muted growth in leverage also reflects lingering caution among bullish traders, many of whom appear hesitant to commit to larger long positions until the market confirms a stronger upward trend.
Market sentiment in the United States has also strengthened following softer-than-expected US labor market data released last week.
Although the Ethereum Coinbase Premium Index, which tracks demand from US investors, remains below zero, it has recovered significantly from the deeply negative levels recorded at the start of July.
This improvement suggests that selling pressure from US-based traders is gradually easing.
Institutional demand has also shown encouraging signs.
According to CoinGlass, US spot Ethereum exchange-traded funds (ETFs) have recorded four consecutive trading sessions of net inflows, reflecting renewed investor interest in $ETH.
Ethereum technical outlook: 50-Day EMA remains a major barrier
On the daily chart, $ETH remains capped below key moving averages.
The liquidation heatmap reveals that Ethereum recorded approximately $76.2 million in liquidations over the past 24 hours, with $47.6 million coming from long positions.
The large number of long liquidations reflects traders being forced to close bullish bets as $ETH dipped lower.
Even so, Ethereum's broader technical structure remains challenging.
On the 4-hour chart, $ETH continues to trade below both its 50-day Exponential Moving Average (EMA) at $1,806 and its 100-day EMA at $1,970, indicating that the medium-term trend has yet to turn decisively bullish.
Momentum indicators present a mixed picture. The Relative Strength Index (RSI) sits at 58, suggesting improving momentum without entering overbought territory.
Meanwhile, the MACD lines are also within the neutral territory, indicating indecision among traders.
Ethereum's first major resistance lies around $1,806, where the 50-day EMA aligns with a key horizontal resistance zone.
If buyers manage to break above this level, attention will shift to $1,909, followed by the 100-day EMA at $1,970.
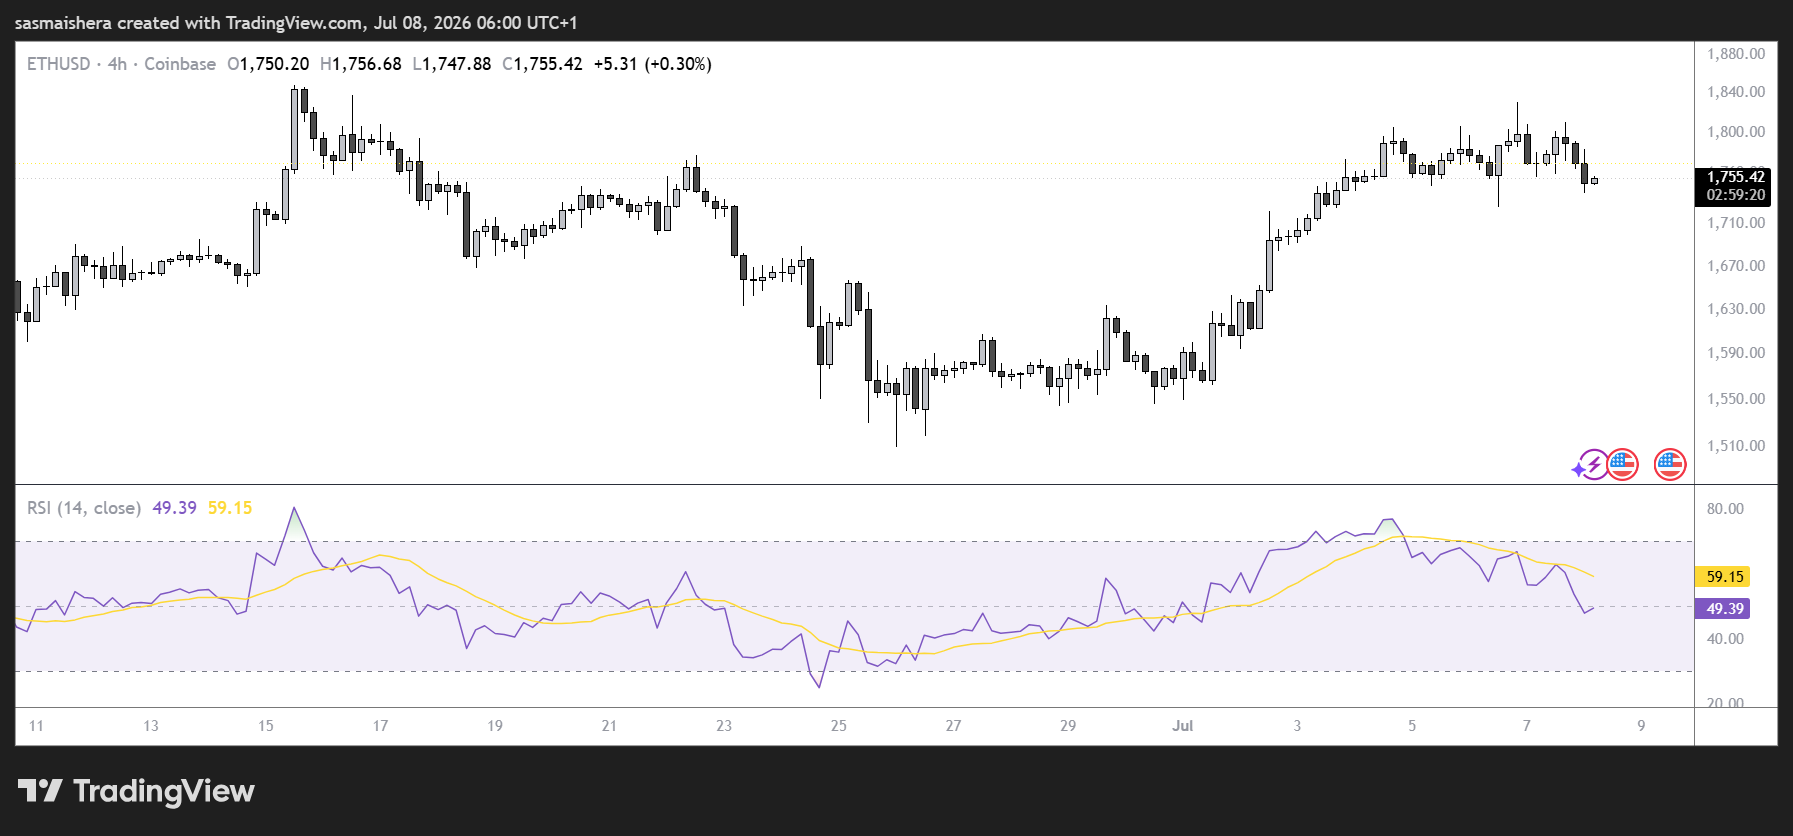
Additional resistance levels are located around $2,018, $2,108, and $2,211, each representing potential obstacles to a sustained bullish breakout.
On the downside, immediate support is found near $1,741, followed by the 20-day EMA at $1,713.
Should selling pressure intensify, $ETH could retest lower support levels around $1,524 and $1,405, while $1,156 remains a significant long-term support area if the broader correction resumes.