
Ethereum is trading near $1,576 as its weekly chart revisits a demand zone that previously marked a major cycle bottom.
The chart, shared by Kamran Asghar on X using TradingView data, compares Ethereum’s current pullback with its 2022 bottom area. $ETH is now trading around the same lower support region, with the analyst marking the zone as a possible area for a bullish reversal if history repeats.
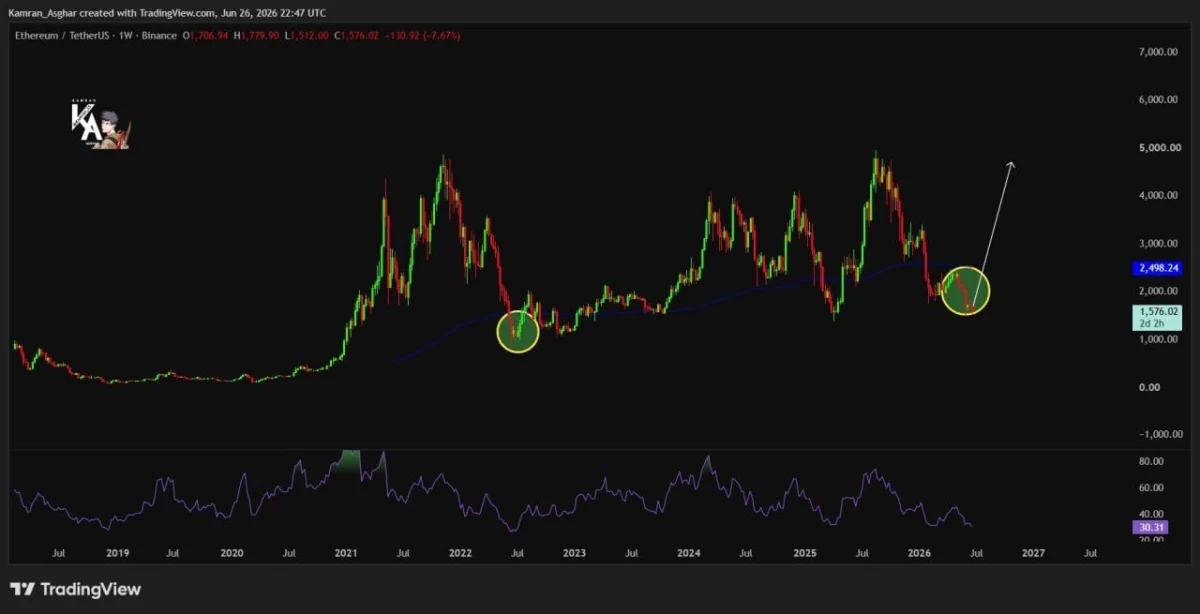
$ETH/$USDT weekly chart. Source: Kamran Asghar on X, TradingView
The setup shows Ethereum below the blue moving average, which is near $2,498 on the chart. That level may act as a major resistance area if $ETH starts to recover. A move back above the moving average would make the reversal case stronger.
RSI is also near 30, close to oversold territory. This suggests selling pressure may be stretched, but it does not confirm that a bottom is already in. $ETH still needs a clear recovery from the demand zone before the chart turns stronger.
For now, the chart shows a possible long-term bounce area, not a confirmed reversal. If $ETH holds the $1,500 to $1,600 zone, buyers may try to push price back toward higher resistance. If that area breaks, the bullish setup would weaken.
Ethereum Chart Points to $1,368 as Key Level to Watch
Ethereum is trading near $1,572 as its monthly chart approaches a key support area watched by traders.
The chart, shared by CJ on X using TradingView data, shows $ETH moving lower after failing to hold higher levels in 2025 and 2026. The analyst points to the equal lows near $1,368 as the next major level that price could test.
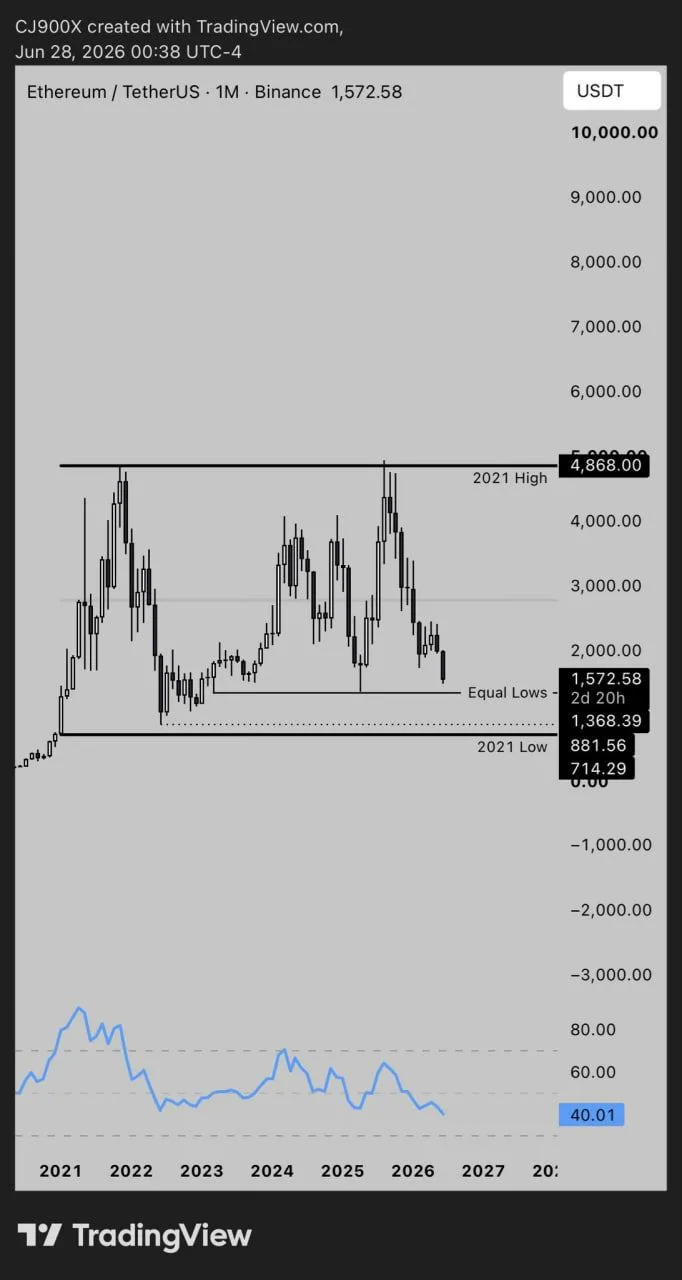
$ETH/$USDT monthly chart. Source: CJ on X, TradingView.
A move toward $1,368 would bring Ethereum back to a support area that has held several times since 2022. If buyers defend that zone, $ETH could attempt a recovery from the lower part of its multi-year range.
However, the chart also marks the 2021 low near $881. That level would become more relevant if $ETH loses the equal lows and selling pressure continues. The monthly RSI sits near 40, showing weak momentum but not yet extreme oversold conditions.
For now, Ethereum remains under pressure. The first level to watch is $1,368. A break below that area would weaken the structure and could open the way toward the lower support zone from 2021.