
Ethereum can't catch a break. After a brutal June sell-off, $ETH ($ETH) has slipped below the critical $1,600 level and is now trading around $1,578 — printing its lowest levels of 2026. With Bitcoin dragging the whole market down, the big question for traders is simple: is $1,400 the next stop, or is a recovery toward $2,000 still on the table?
Let's break down the chart, the key levels, and what it would take for Ethereum to turn around.
Why has Ethereum Price fallen below $1,600?
This isn't an Ethereum-specific problem — it's a Bitcoin-driven, market-wide flush. $ETH has been one of the worst-performing majors throughout the recent crash, and the macro backdrop has been relentless: a hotter-than-expected inflation print, a Fed narrative that flipped from rate cuts to potential hikes, and persistent ETF outflows have all weighed heavily on risk assets.
$Ethereum has been hit especially hard because capital keeps flowing toward Bitcoin. $ETH sits below every major daily moving average while Bitcoin dominance has climbed above 56%, leaving altcoins starved of capital and bulls with almost nothing to work with. When $BTC dominance rises in a falling market, $ETH and other altcoins tend to bleed twice as fast.
The damage is severe on a longer lens. Ethereum hit a roughly 13-month low in early June 2026, and from the August 2025 all-time high near $4,954, the price represents a decline of roughly 60%.
Ethereum Price Analysis: Key Levels to Watch
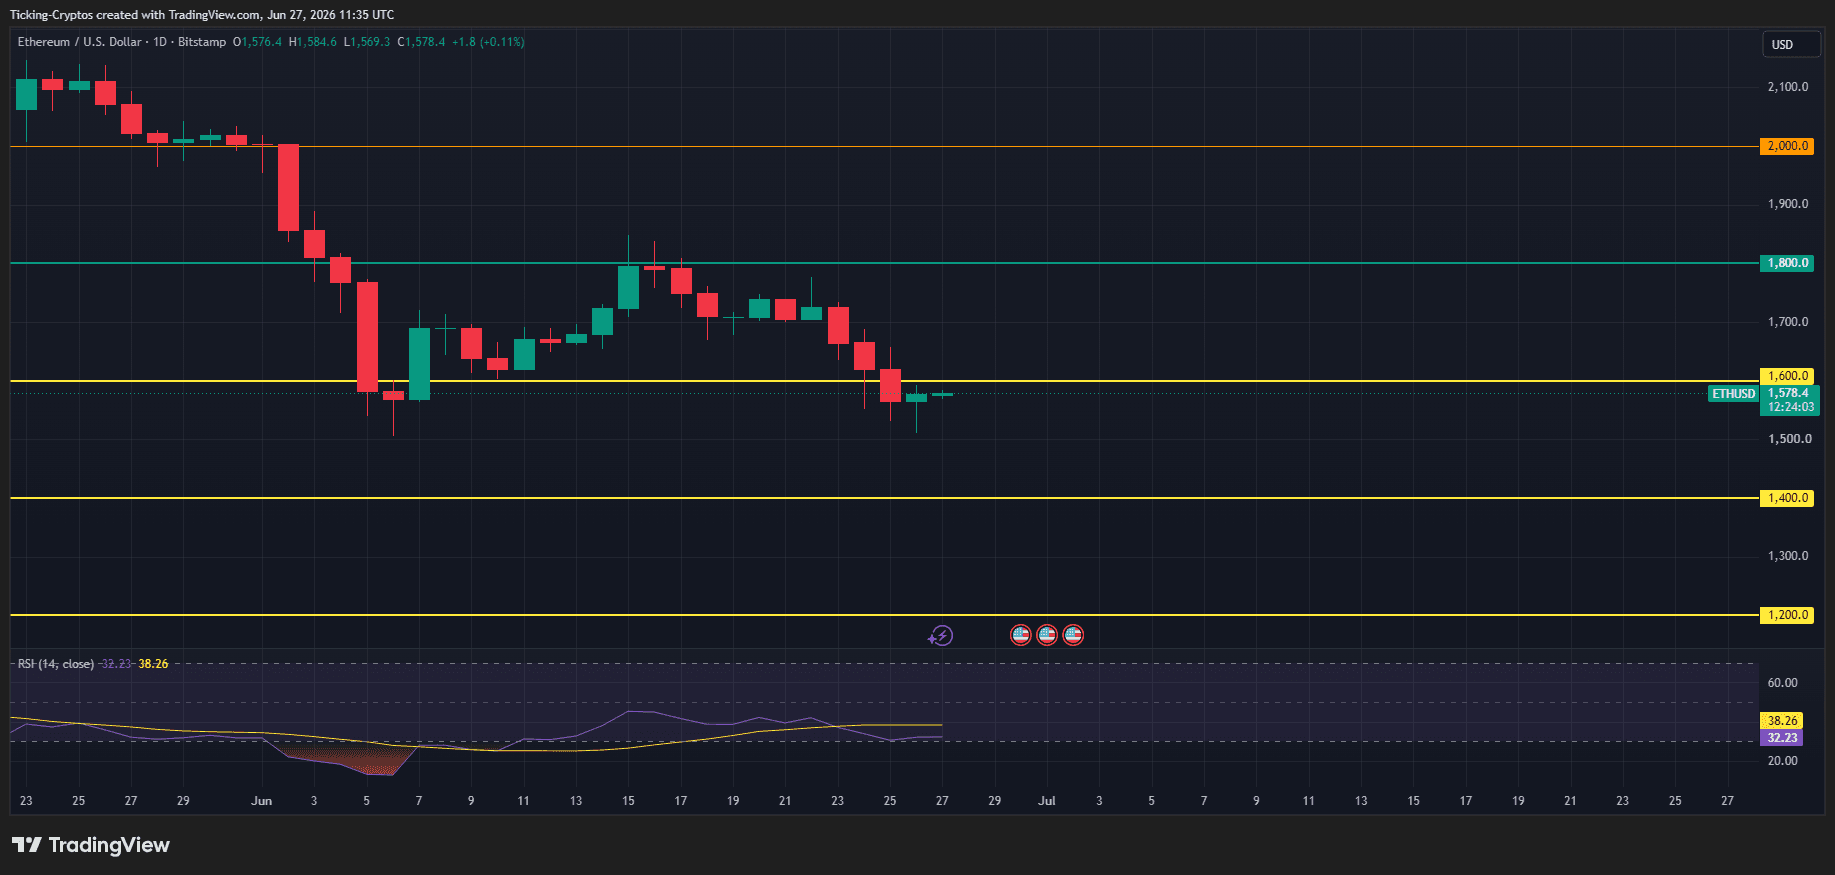
The daily chart paints a clearly bearish structure. After breaking down from the $2,000 region in early June, $ETH has been locked in a steady downtrend, repeatedly making lower highs.
The key technical takeaways:
- $1,600 has flipped from support to resistance. The orange line near $1,600 that previously acted as a floor has now broken, and $ETH is hovering just below it. That makes $1,600 the first hurdle bulls need to reclaim.
- The $1,800 level is the bigger battle. The green line at $1,800 marks the level where June's relief bounce peaked before rolling over. It's now significant overhead resistance.
- $1,400 and $1,200 are the safety nets. The yellow support lines below current price sit at $1,400 and $1,200 — the levels that come into play if selling accelerates.
- RSI at 38.26. Momentum is bearish but not yet deeply oversold on the daily. An RSI in the high 30s means there's still room to fall before sellers are exhausted — a caution flag for anyone calling an immediate bottom.
The structure is unambiguous: until $ETH reclaims $1,600 and then $1,800 with conviction, the path of least resistance points lower.
Ethereum price prediction: how low can $ETH Coin go?
If $1,600 fails to reclaim as support, the downside levels are clearly mapped on the chart. The next major shelf sits at $1,400, followed by the deeper $1,200 support.
Analysts have flagged similar danger zones. The $1,500–$1,600 zone is described as a critical support shelf, but analysts warn that price alone does not confirm it as a bottom — that requires sustained demand, not just a bounce. The mechanics of a breakdown are what make lower targets realistic. Once support fails, deleveraging tends to feed on itself, with the move toward the next band driven by forced exits rather than changing conviction.
The technical backdrop keeps sellers in control on every bounce. Price sits below the 20-day EMA at $1,733, the 50-day EMA at $1,881, and the 200-day EMA at $2,390 — a classic bearish cascade where the trend is down and the burden of proof rests entirely on the bulls.
A breakdown below $1,400 would put the $1,200 zone squarely in focus — a level that would represent significant further pain but isn't off the table in a prolonged risk-off environment.
What would trigger a recovery to $1,800–$2,000?
Here's the other side of the trade — and it hinges almost entirely on one thing: Bitcoin.
Ethereum's near-term fate is tied directly to $BTC. If buyers successfully defend the current support zone and Bitcoin regains bullish momentum, Ethereum is well-positioned to participate in the next major crypto market advance and could establish a durable bottom. In other words, $ETH likely won't recover on its own — it needs Bitcoin to stabilize first.
The roadmap back up is clear from the chart. The first step is reclaiming $1,600 as support, then breaking the $1,700–$1,750 resistance band. $ETH must reclaim the $1,800–$1,900 region to strengthen the bullish outlook for the remainder of 2026, and holding above the key levels remains critical for maintaining recovery momentum. Above $1,800, the $2,000 psychological level — where $ETH broke down in early June — becomes the next major target.
There are also structural tailwinds if sentiment turns. Anchored volume profile support in the $1,500–$1,700 range, plus a rise in real-world asset tokenization to $17.90bn on Ethereum's network, could attract renewed institutional demand at lower levels. And the longer-term bull case remains explicitly a Bitcoin bet — as Fundstrat's Tom Lee frames it, the bull case for $ETH rides on Bitcoin's trajectory and a broader risk-on macro turn.
The levels that matter
For your Ethereum price prediction watchlist, keep these on the radar:
- Immediate resistance: $1,600 (reclaim needed first), then $1,700–$1,750.
- Major resistance: $1,800, then the $2,000 psychological level.
- Immediate support: the current $1,550–$1,580 zone.
- Downside targets if support breaks: $1,400, then $1,200.