
Ethereum is sitting above a support zone that has protected every major low since 2022. Holding $1,500 could keep the long-term recovery case alive, while a weekly breakdown would put bullish targets near $5,100 and beyond in doubt.
Ethereum Mirrors Russell 2000 Breakout as Bulls Eye $5,100
Ethereum may be forming a similar long-term structure to the Russell 2000, which has already broken above major resistance following a multi-year recovery.
The weekly chart compares $ETH with the US small-cap index. Both formed rounded bases after major market declines, followed by recoveries toward long-standing resistance levels.
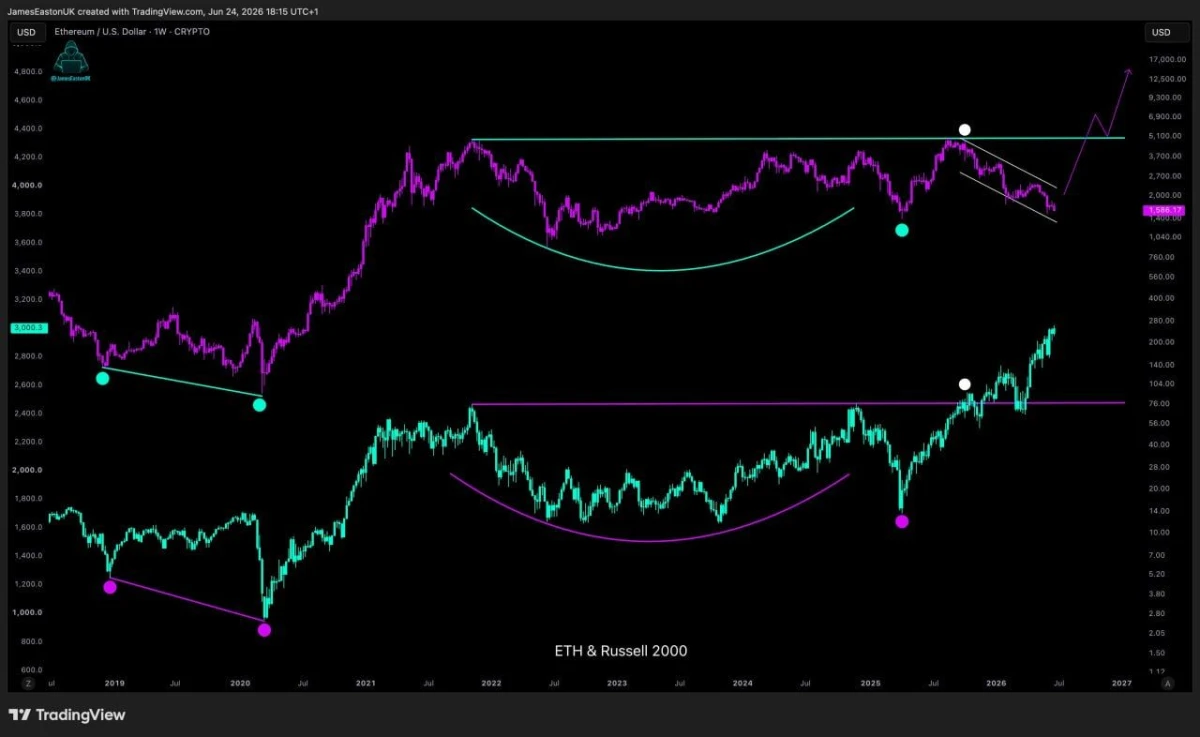
Ethereum and Russell 2000 Weekly Comparison Chart. Source: James Easton (@JamesEastonUK) on X
The Russell 2000 has now moved above its horizontal resistance area near 2,500, strengthening its broader bullish structure. Ethereum, however, remains below its equivalent resistance zone near $4,300–$5,100 and is still trading inside a short-term descending channel.
According to James Easton, the Russell 2000 breakout could offer a possible roadmap for Ethereum. If $ETH breaks above the falling channel and begins a sustained recovery, the first major test would be the previous all-time-high region.
A confirmed move above approximately $5,100 could place Ethereum in price discovery. The chart projects a much larger move toward five-figure levels, potentially above $10,000, although this is a speculative long-term scenario rather than a confirmed forecast.
The comparison also has limits. Ethereum and the Russell 2000 are different assets, and similar chart structures do not guarantee the same outcome. $ETH must first reverse its current downtrend and reclaim nearby resistance before the larger bullish case becomes credible.
Ethereum Defends $1,500 as Its Bullish Structure Faces a Critical Test
Ethereum is trading just above a support zone that has protected every major market low since the 2022 bear market bottom.
The weekly chart shows $ETH near $1,618, with the highlighted support area extending around $1,500–$1,650. Ethereum previously rebounded from this region in 2023, late 2023 and 2025, making it an important level for the broader market structure.
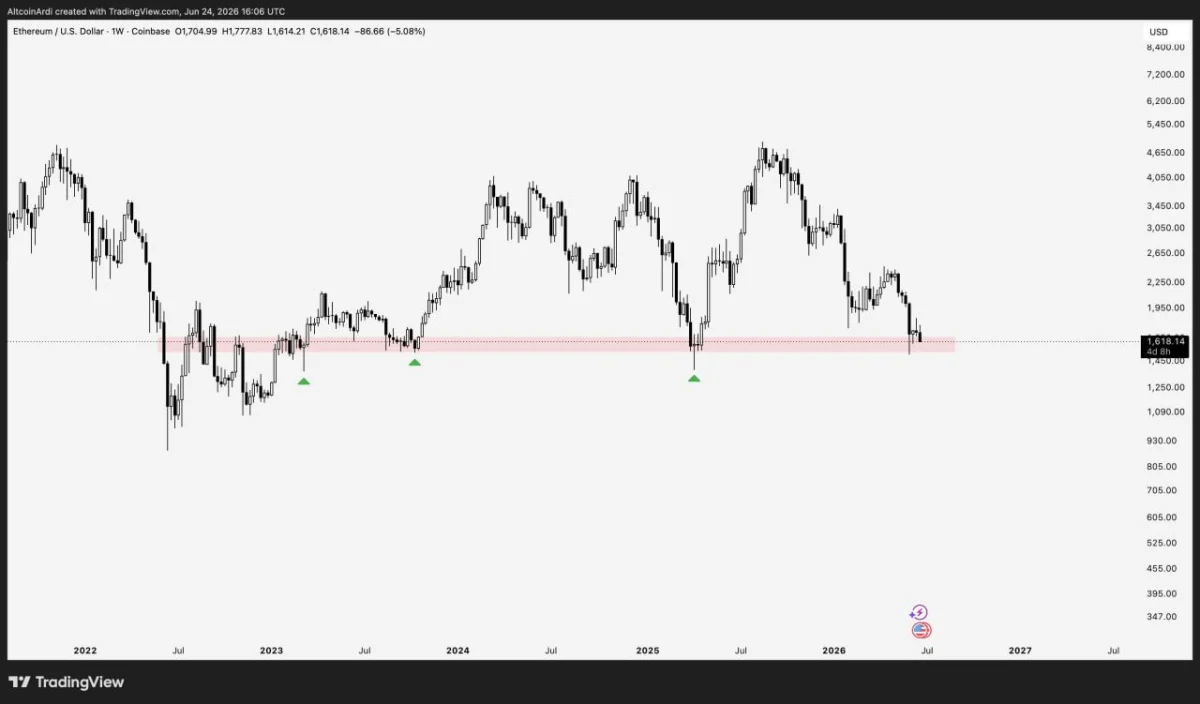
$ETH/USD Weekly Multi-Year Support Chart. Source: Ardi (@ArdiNSC) on X
According to Ardi, the key signal is not a brief move below $1,500 but whether Ethereum begins recording weekly closes beneath it. Holding above the level would keep the multi-year support structure intact and leave room for another recovery.
However, repeated weekly closes below $1,500 would mark a clear structural breakdown. It would show that an area buyers have defended for several years is no longer holding, forcing traders to reconsider bullish long-term projections.
For the outlook to improve, $ETH must first defend $1,500 and recover above nearby resistance around $1,900–$2,000. Until then, Ethereum remains close to support but under significant selling pressure.