
Ethereum is trying to turn its latest rebound into a confirmed recovery, with analysts watching two key signals: a reclaim of $2,000 and a bullish MACD cross.
Nebraskangooner says $ETH may have formed a bottom if it can move back above $2,000, while MikybullCrypto sees the MACD setup opening the door to a move above $2,400.
Ethereum is showing early signs of recovery, but a key resistance level still stands in the way of confirming a broader trend reversal, according to crypto analyst Nebraskangooner.
In a post on X, the analyst said $ETH is displaying "some promising signs locally" but cautioned that "a lot of work" remains before a bottom can be confirmed.
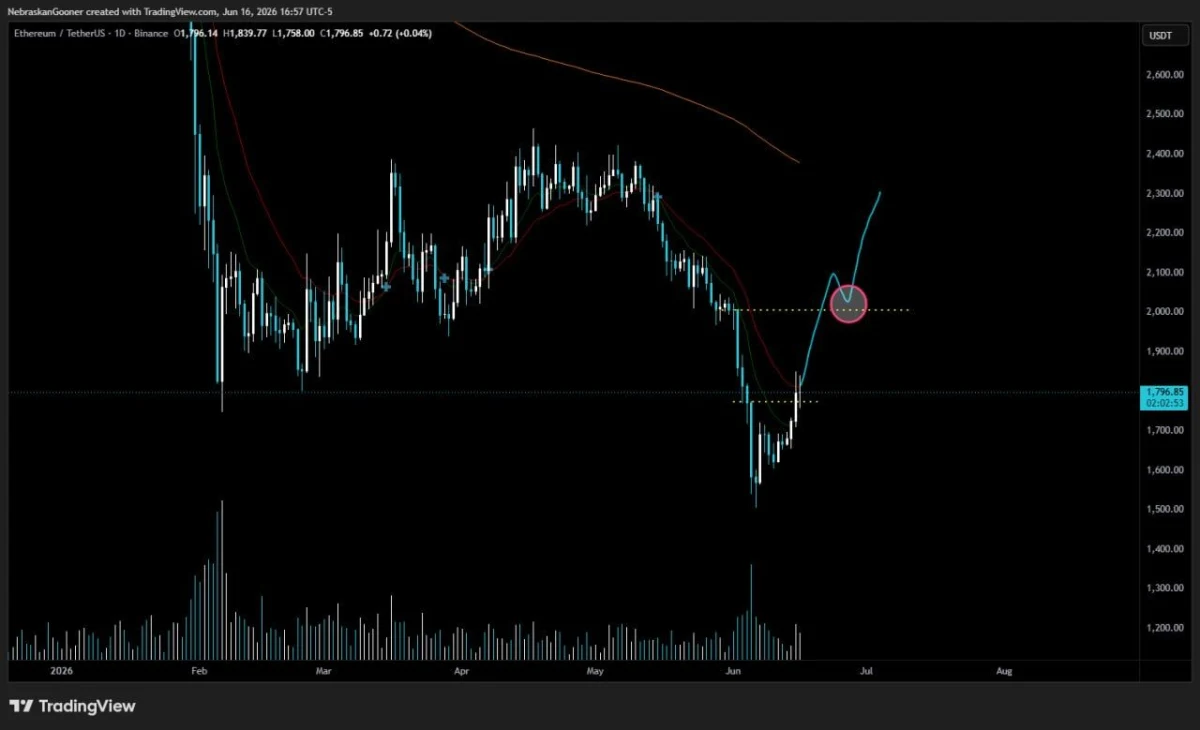
$ETH/$USDT Daily Chart Source: Nebraskangooner (@Nebraskangooner)
The daily $ETH/$USDT chart on Binance shows Ethereum rebounding from recent lows near the $1,500 area after a sharp sell-off earlier this month. Shorter-term moving averages have started to turn higher, reflecting improving momentum.
However, Nebraskangooner identified $2,000 as the critical level to watch. The chart highlights that zone as a major resistance area and suggests Ethereum may need to reclaim and hold above it before traders can confidently call a market bottom.
"If it gets back above $2k then I would say this is probably bottom," the analyst wrote.
The chart also outlines a projected path in which $ETH breaks above $2,000, briefly retests the level as support and then extends its recovery toward the $2,300 region.
For now, Ethereum's rebound remains constructive but unconfirmed. A move above $2,000 would strengthen the bullish case, while another rejection below that level could signal that the recovery still has further to prove.
Ethereum could be preparing for a stronger recovery after flashing a bullish signal on the MACD indicator, according to crypto analyst MikybullCrypto.
In a post on X, the analyst pointed to a bullish MACD crossover on $ETH's daily chart and said the setup could send Ethereum above $2,400.
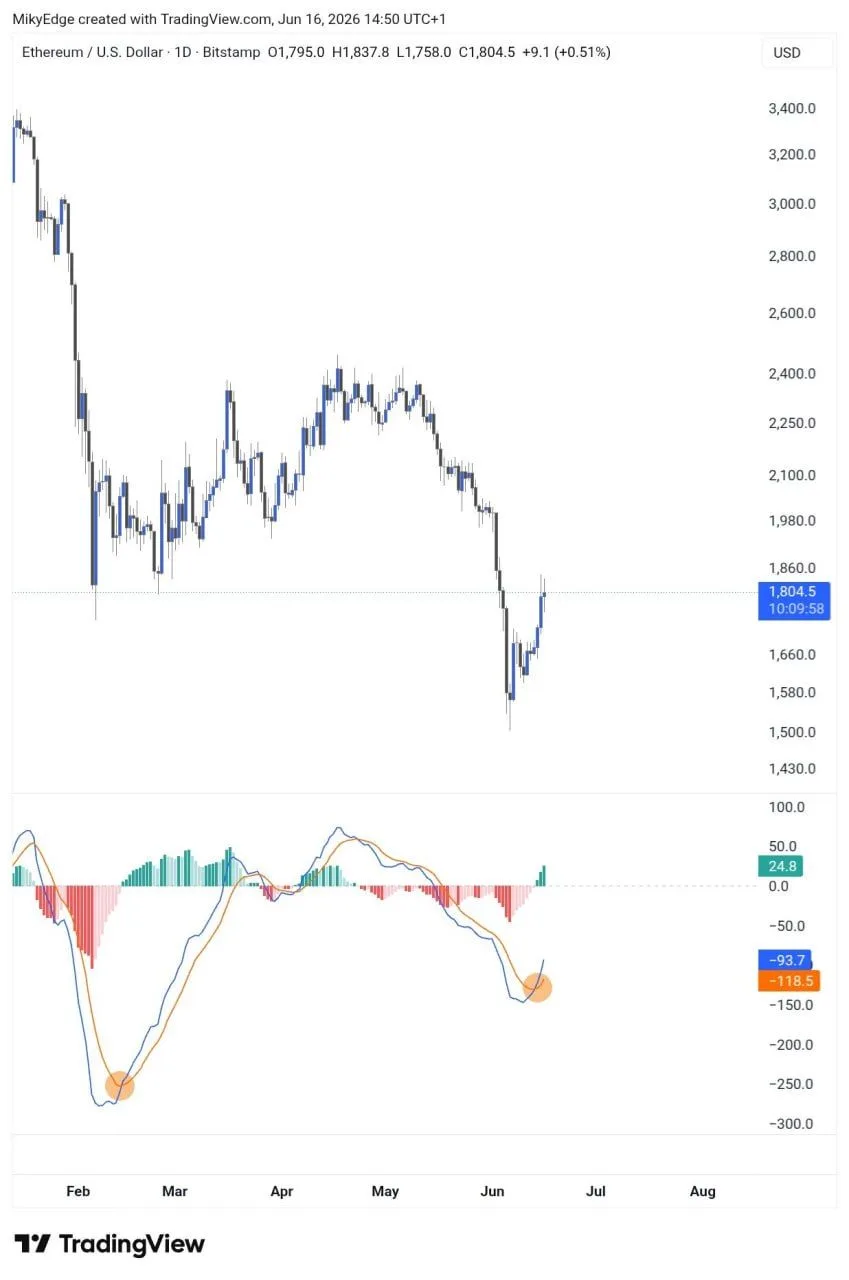
$ETH/USD Daily MACD Chart Source: MikybullCrypto (@MikybullCrypto)
The daily $ETH/USD chart on Bitstamp shows Ethereum rebounding from recent lows near the $1,500 level, with $ETH trading around $1,804 at the time of the analysis.
The focus of the chart is the Moving Average Convergence Divergence, or MACD, indicator. The blue MACD line has crossed above the orange signal line while the histogram has turned positive, a development traders often interpret as an early sign of strengthening momentum.
MikybullCrypto also highlighted a similar MACD crossover that appeared earlier this year and preceded a rally toward the $2,400 area. The analyst suggested the current setup could produce a comparable move if bullish momentum continues to build.
However, MACD signals are not foolproof and can generate false breakouts, particularly during volatile market conditions.
For now, traders will be watching whether Ethereum can build on its recent rebound and validate the bullish signal with a sustained move higher. A push above $2,400 would support the analyst's outlook and mark a significant recovery from June's lows.