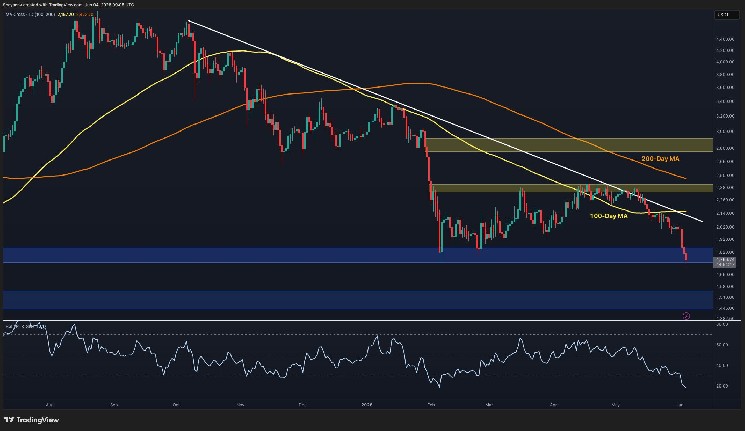
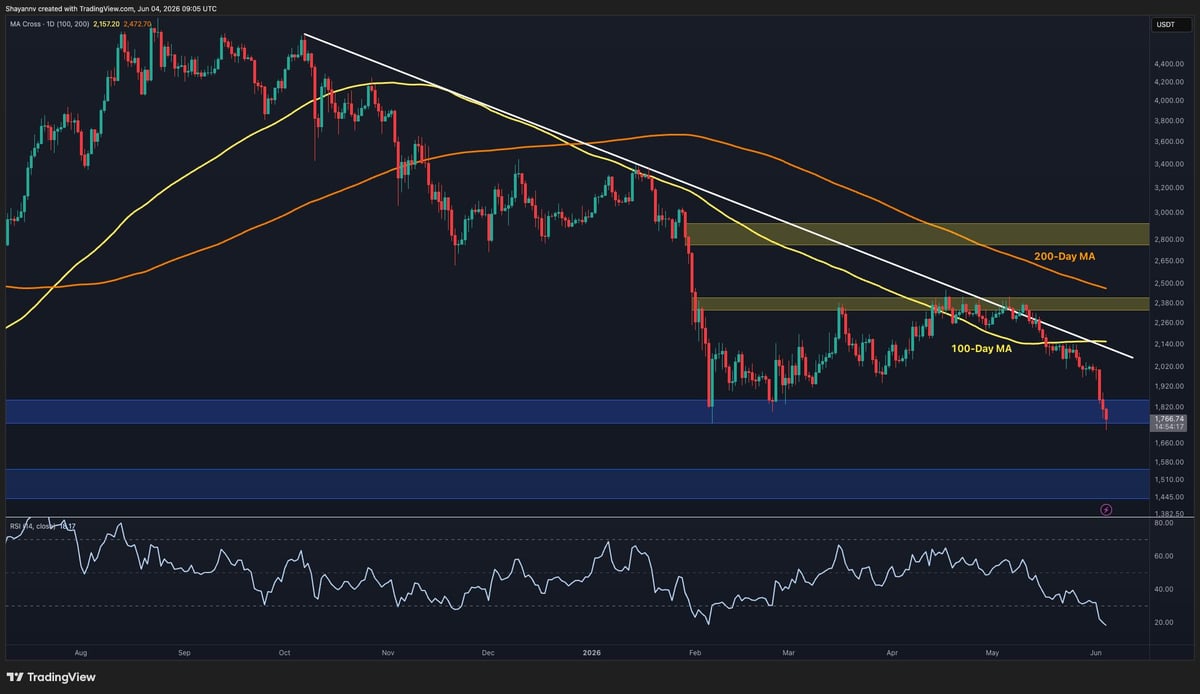
The price is now breaking below the $1.8K support zone, which represents a significant technical development. This area had acted as a market floor since February. With the price now trading beneath that level near $1.76K, the former support is turning into immediate resistance.
If sellers maintain control, the next major demand zone is located around $1.5K, which represents the next visible daily support area. A deeper correction could expose that region in the coming weeks. On the upside, bulls would first need to reclaim the $1.8K zone before targeting the resistance cluster just above $2k. Until then, everything on the daily chart is extremely bearish.
$ETH/USDT 4-Hour Chart
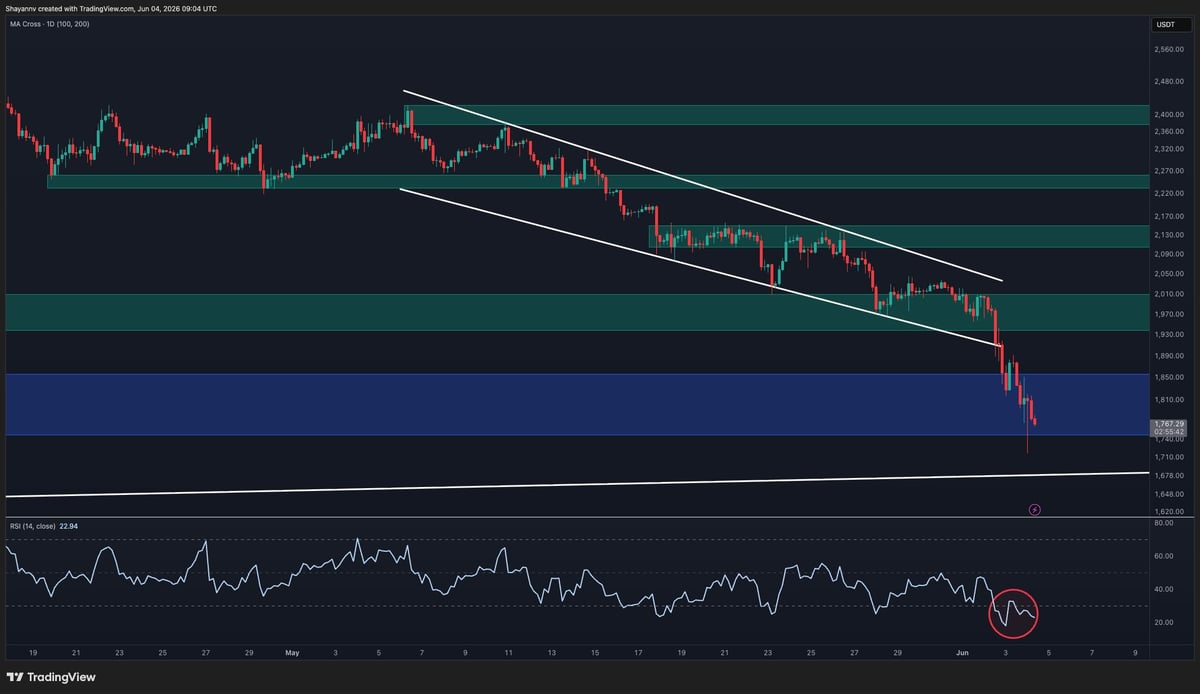
The 4-hour chart paints an equally weak picture. $ETH broke below a descending channel that had contained price action throughout May, signaling an acceleration of the bearish trend rather than a bullish breakout. Alongside the channel breakdown, Ethereum sliced through the $2K support area and is losing the critical $1.8K zone.
The price is currently testing the lower boundary of the $1.75k-$1.8k demand area. While this region could trigger a short-term bounce due to its historical significance, the overall structure remains bearish unless $ETH can recover above the $1.8k mark and consolidate.
The 4-hour RSI is also deeply oversold near 20. This reflects aggressive downside momentum. Although bearish exhaustion may be developing, there is currently no confirmed bullish divergence visible on the chart, and therefore, there is no sign pointing to even a small bounce that could stabilize the market for a while.
Sentiment Analysis
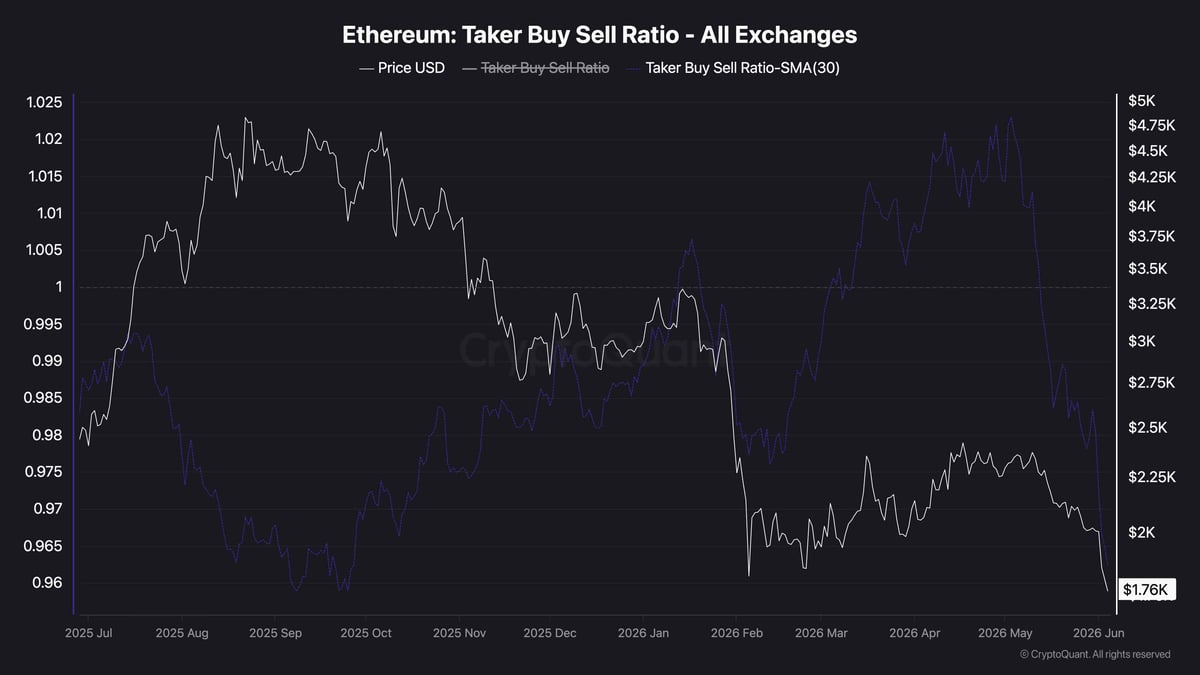
The Ethereum Taker Buy/Sell Ratio provides additional evidence that market participants remain heavily skewed toward selling activity. This metric compares aggressive buy orders against aggressive sell orders across exchanges, with readings above 1 indicating stronger buying pressure and readings below 1 signaling seller dominance.
The ratio has fallen sharply to roughly 0.96, marking one of the lowest readings on the chart and extending a persistent decline that began after the April-May recovery attempt. The sustained positioning of the metric below the neutral 1.0 level suggests that market takers continue to favor sell orders, reinforcing the bearish trend visible on both the daily and 4-hour charts.
For the outlook to improve, the ratio would ideally need to reclaim and sustain levels above 1.0, indicating that aggressive buyers are returning to the market. Until that occurs, the futures positioning data continues to support the broader bearish narrative and suggests that downside risks remain elevated despite increasingly oversold technical conditions.

 cryptopotato.com