
Ethereum ($ETH) has officially broken below its highly watched $2,000 psychological support zone. As the broader digital asset ecosystem faces renewed selling pressure, the second-largest cryptocurrency by market capitalization is struggling to find stable ground.
While the drop past $2,000 represents a significant blow to short-term bullish momentum, historical chart structures suggest that a much stronger floor awaits lower on the horizon. Traders are now shifting their attention to the $1,800 level as the next key defensive zone for buyers.
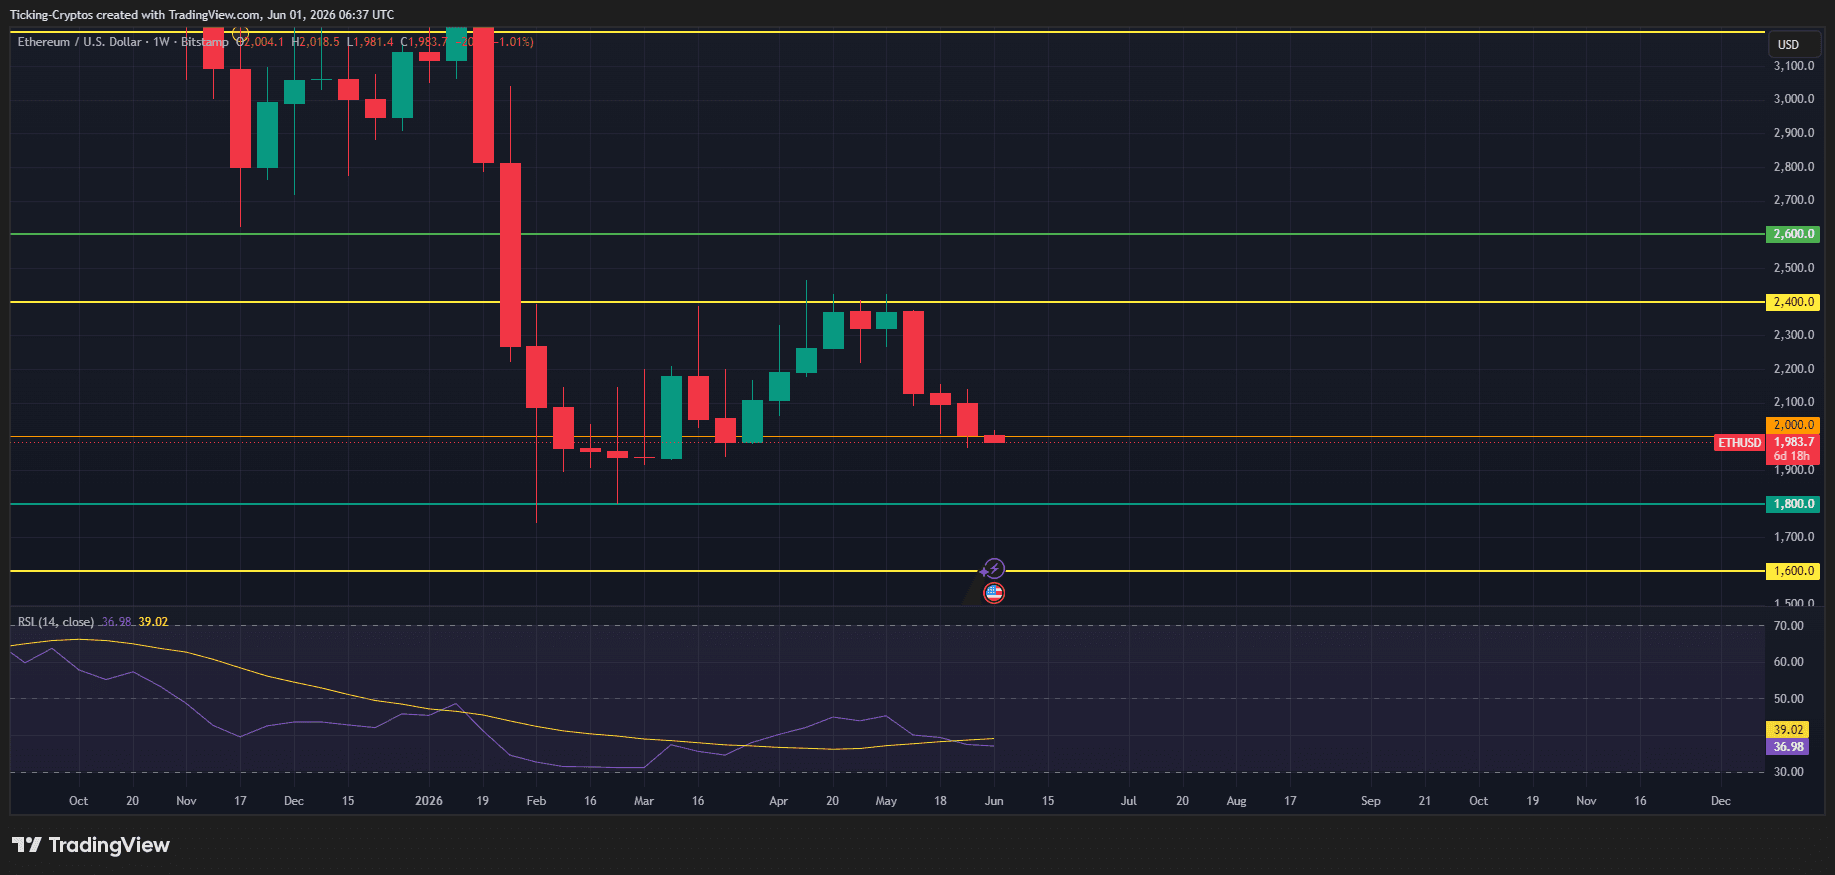
Technical Breakdown: Analyzing the $ETH/USD Weekly Chart
According to the weekly $ETH/USD chart, Ethereum has entered a clear short-term bearish phase following a multi-week rejection from higher macro levels.
1. The Fall of the $2,000 Pivot Zone
The $2,000 price point is more than just a horizontal support line; it acts as an anchor for market sentiment. After spending the earlier part of the year consolidating above this region, the latest weekly candlestick shows clear bearish continuation. The price is currently hovering around $1,983.70, turning the previous orange support band into an immediate overhead resistance line.
2. Why $1,800 Stands as a Stronger Floor
If selling volume persists, the immediate downside target sits at $1,800 (marked by the green support line on the chart).
- Historical Validation: This zone served as a critical accumulation area during the market's recovery phases in late 2025 and early 2026.
- Order Block Density: Unlike the thin liquidity observed during the breakdown from $2,400, the $1,800 zone features a dense cluster of historical buyer interest, making it a structurally tougher wall for bears to crack.
3. Relative Strength Index (RSI) Deepens Into Bearish Territory
The 14-period Relative Strength Index (RSI) on the weekly timeframe is currently printing at 36.98, well below its yellow moving average line of 39.02. Because the RSI is trending downward toward the 30 oversold boundary without showing an immediate bullish divergence, the momentum remains firmly in control of the sellers.
Macro Context and Market Sentiment
The broader crypto landscape is reflecting this cautious posture. While institutional milestones like ongoing spot exchange-traded fund (ETF) flows offer structural support to the digital asset class long-term, short-term macroeconomic pressures are driving capital toward safer allocations.
According to market updates, overall crypto spot volumes have slowed down, allowing derivatives shorts to exert disproportionate weight on the underlying spot prices. For Ethereum to invalidate this bearish trajectory, bulls must aggressively reclaim the $2,000 level on a weekly closing basis and push back toward the $2,400 major resistance line. Failing to do so opens the door wide for an extended retest of the lower value areas.
The Next Bearish Targets
If the sell-off intensifies and the structural support at $1,800 fails to hold, the macro chart points to an ultimate capitulation target near $1,600 (denoted by the lower yellow boundary line). However, given the depth of buying orders typically resting near the $1,800 mark, an immediate drop to $1,600 remains an outlier scenario unless triggered by extreme industry-wide liquidations.
Traders should monitor the daily close relative to the $1,980 region to determine if this breakdown is a temporary liquidity sweep or a confirmed descent into the deeper accumulation blocks.