
 en.coinotag.com

Ethereum ($ETH) price is about to close May 12.6% in the red as $401.62 million in $ETH spot ETF outflows hit sentiment.
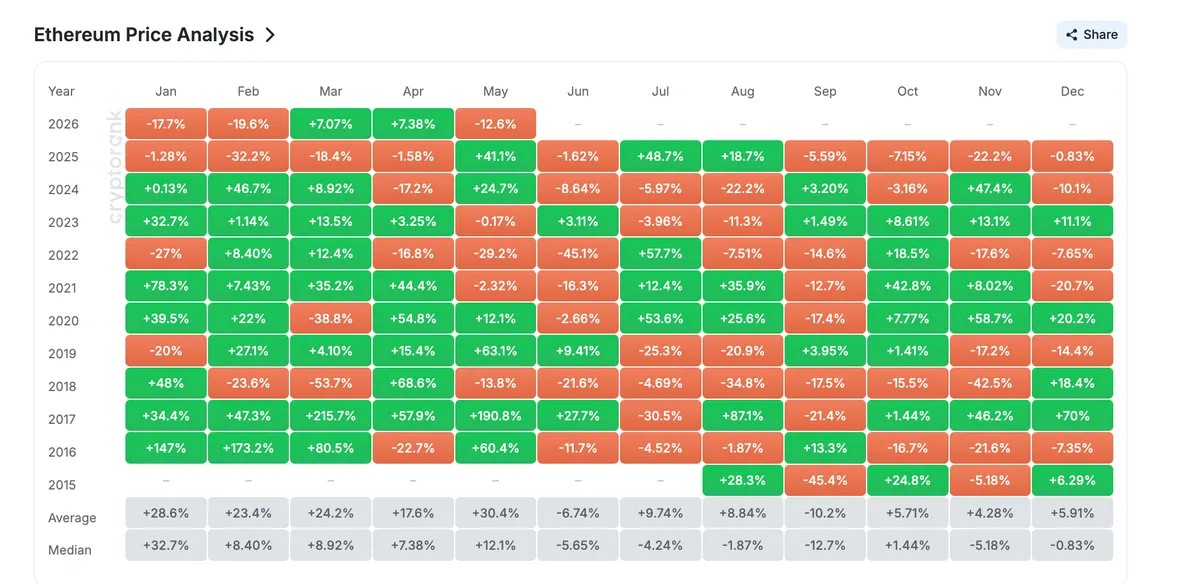
The drop broke a streak that saw May close green in 2024 and 2025. With June historically a weak month for $ETH, the setup pits ETF outflows and bearish seasonality against fresh signs that whales and long-term holders are buying.
ETF Outflows Just Broke Ethereum’s Two-Year May Streak
May 2026 was supposed to be one of Ethereum’s strongest months. It was a good month in 2024 at +24.7% and the second best in 2025 at +41.1%. This year it is sitting 12.6% in the red.
The Ethereum ETF outflows explain why. US $ETH spot ETFs logged a net outflow of $401.62 million in May. That is the third-largest monthly outflow since late 2025, behind November 2025 at -$1.42 billion and December 2025 at -$616.82 million.
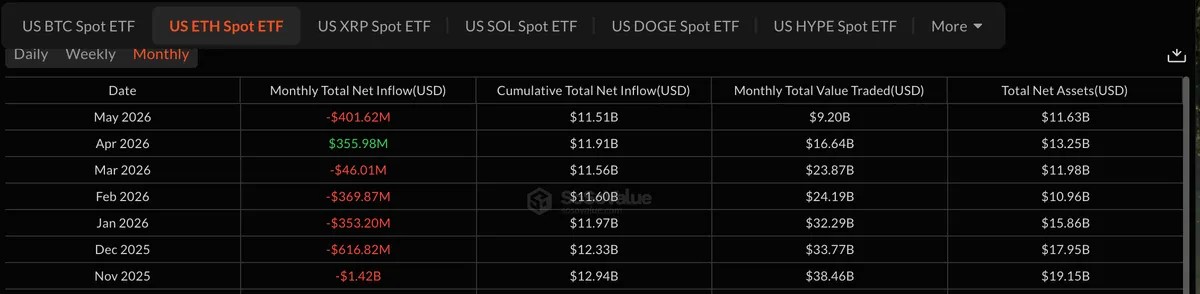
The fingerprint of ETF flows on monthly performance has been clean throughout 2026. March outflows were near-neutral at -$46.01 million and $ETH closed +7.07%. April flipped to +$355.98 million in net inflows and $ETH gained +7.38%. May reversed to deep outflows and price collapsed. This pattern shows how important ETF flows are to the $ETH price action.
Want more token insights like this? Sign up for Editor Harsh Notariya’s Daily Crypto Newsletter here.
Historical seasonality also tilts bearish heading into June. The average June return for $ETH since 2016 sits at -6.74%, with a median of -5.65%. Only three Junes have closed green in a decade. The question now is whether the ETF bleed extends into June or pauses long enough for the chart pattern to resolve. The on-chain side of the order book gives the first hint.
Ethereum Whales and Hodlers Hint at Quiet Accumulation Through the Bleed
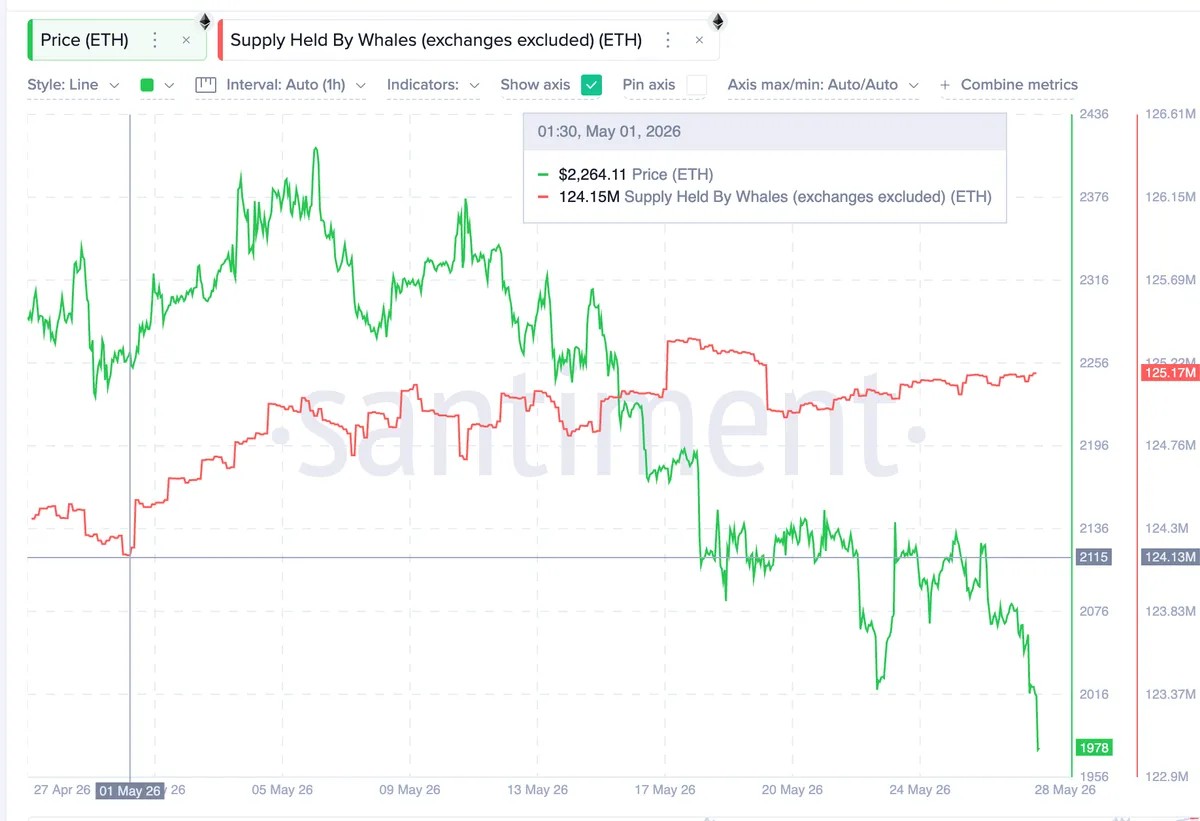
The Ethereum whales behind the recent move have not blinked. Per Santiment, the supply held by $ETH whales excluding exchanges climbed from 124.15 million $ETH on May 1 to 125.17 million currently. That’s over $2 billion in steady accumulation.
The whales took some profits along the way but added more on net even as price fell 12% over the same window.
The Glassnode Hodler Net Position Change, a metric that tracks mid-to-long-term holder accumulation and distribution, tells a sharper story. The indicator was deeply red through early February 2026, lining up with one of the worst stretches of ETF outflows and $ETH’s most painful drop in 2026.
That correlation has not shown up this time. The hodler metric has stayed green continuously since February 24 and has grown in size since mid-May.
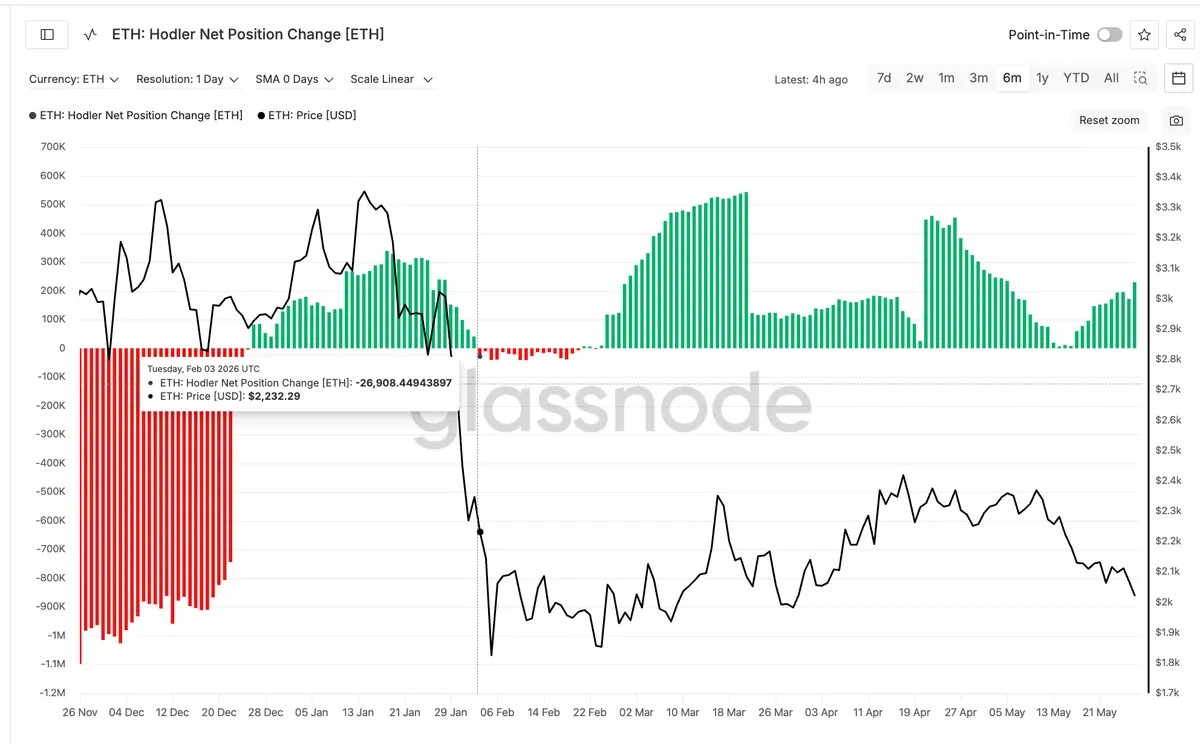
The contrast with February 2026 matters. That was the only stretch in 2026 where hodler conviction broke, and $ETH fell 19.6% that month. The current correction has not flipped the same dial, suggesting long-term holders may be treating this drawdown as a buying opportunity rather than a panic exit.
The $ETH price chart now has to choose between flow-driven weakness and conviction-driven absorption.
A Bearish Inverted Cup Pattern Carries a Small Bullish Twist
On the two-day chart, Ethereum technical analysis since late March shows a clean inverted cup forming. The peak of the cup printed in mid-April. Price has since arced back down to the level where the pattern began, completing the bearish dome shape.
If a rebound happens from here, it would mostly form the handle of an inverted cup-and-handle pattern. This is a continuation pattern of a bearish bias. A short-lived supposed bounce inside the structure does not flip the broader thesis. The pattern still points down after the handle.
A developing hidden bullish divergence between price and the Relative Strength Index (RSI), a momentum oscillator that measures the speed of recent price moves, gives the rebound case its only technical support. Between March 28 and May 27, $ETH is close to printing a higher low while the RSI is forming a lower low. Hidden bullish divergence in a downtrend typically precedes a relief bounce, not a trend reversal.
The divergence confirms if the next $ETH 2-day candle forms above $1,964.
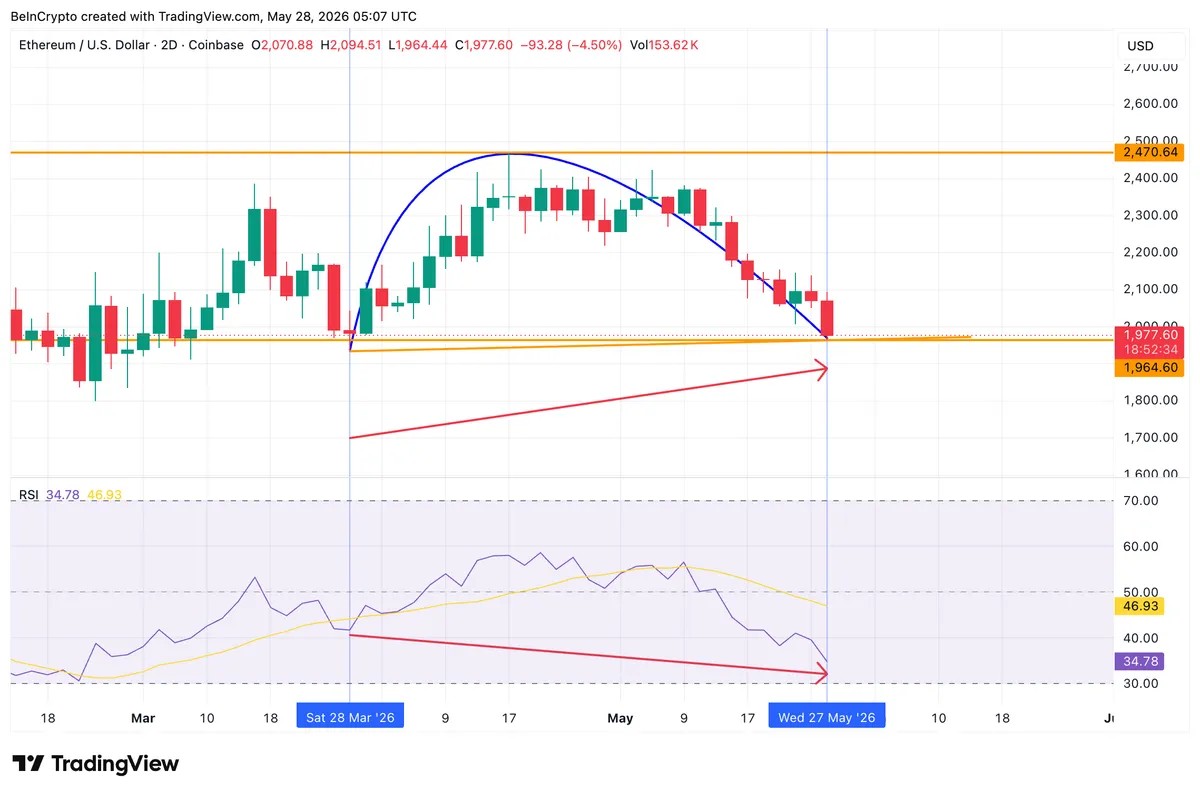
The pattern and the divergence agree on direction in the short term and disagree on the magnitude. A bounce is likely, more so with whale and hodler accumulation to support. But a reversal is not. The cost basis distribution tells us where that bounce can run before sellers reappear.
Cost Basis Map Sets Ethereum Price Levels for June
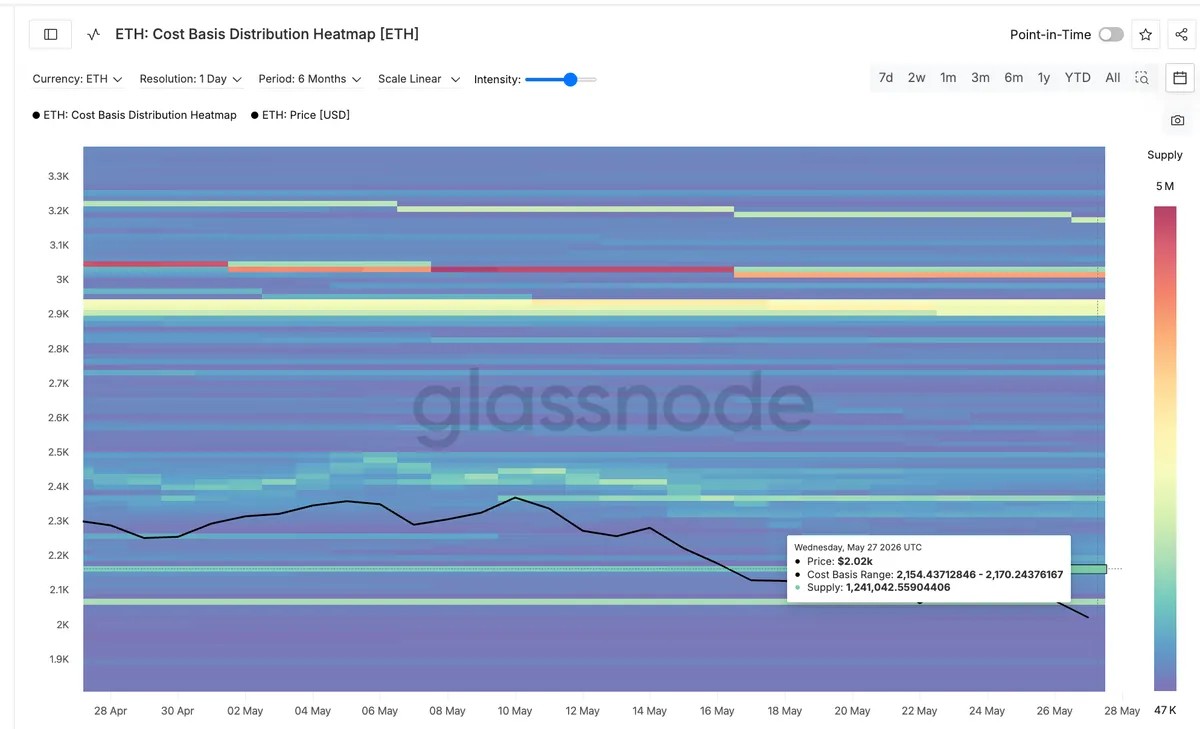
$ETH trades near $1,977 at press time. The Glassnode Ethereum cost basis distribution heatmap shows two dense clusters above the current price. The lower cluster sits at $2,059 to $2,075, holding 1.37 million $ETH.
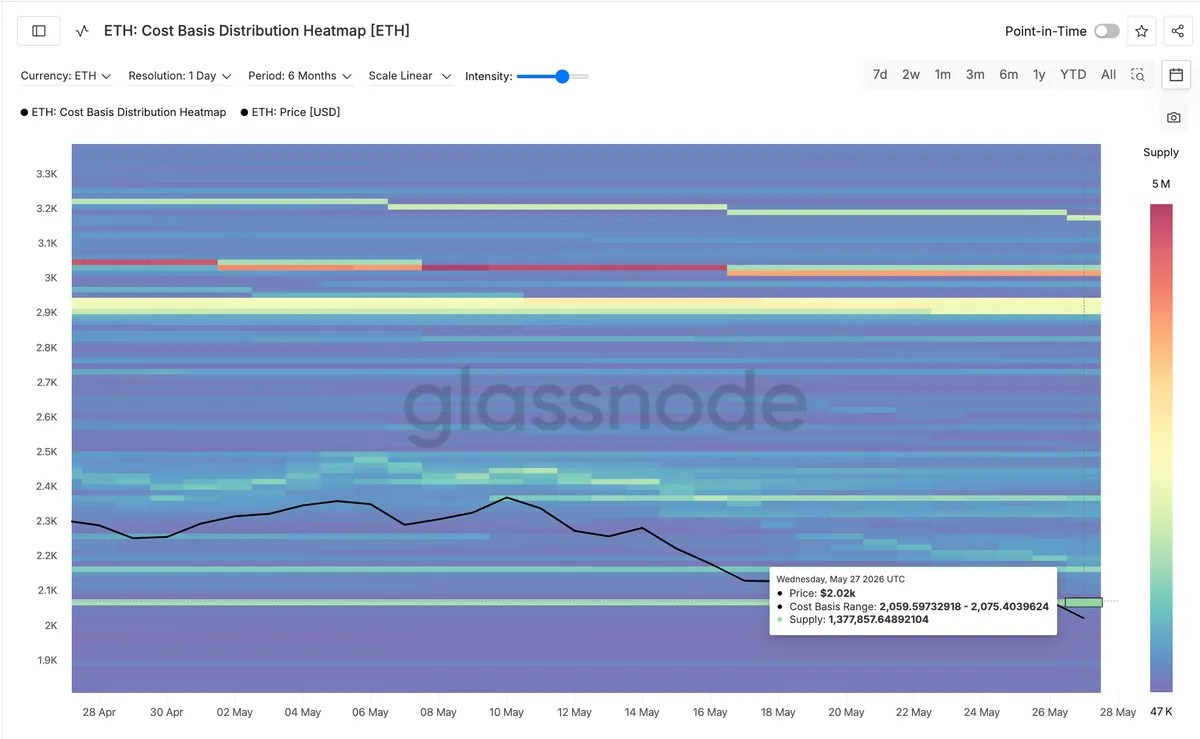
The higher cluster sits at $2,154 to $2,170, holding 1.24 million $ETH. These are zones where prior buyers entered, which often act as resistance on a relief bounce as those wallets break even.
The Fibonacci levels on the move from the late March bottom to the mid-April top maps almost exactly onto these clusters. The 0.618 Fib at $2,055 aligns with the lower cost basis cluster. The 0.5 Fib at $2,134 sits at the doorstep of the higher cluster. A rebound from current levels into the handle of the inverted cup would likely top out between $2,055 and $2,134 in June before sellers reappear. The full cup invalidation at $2,471 stays out of reach for now.
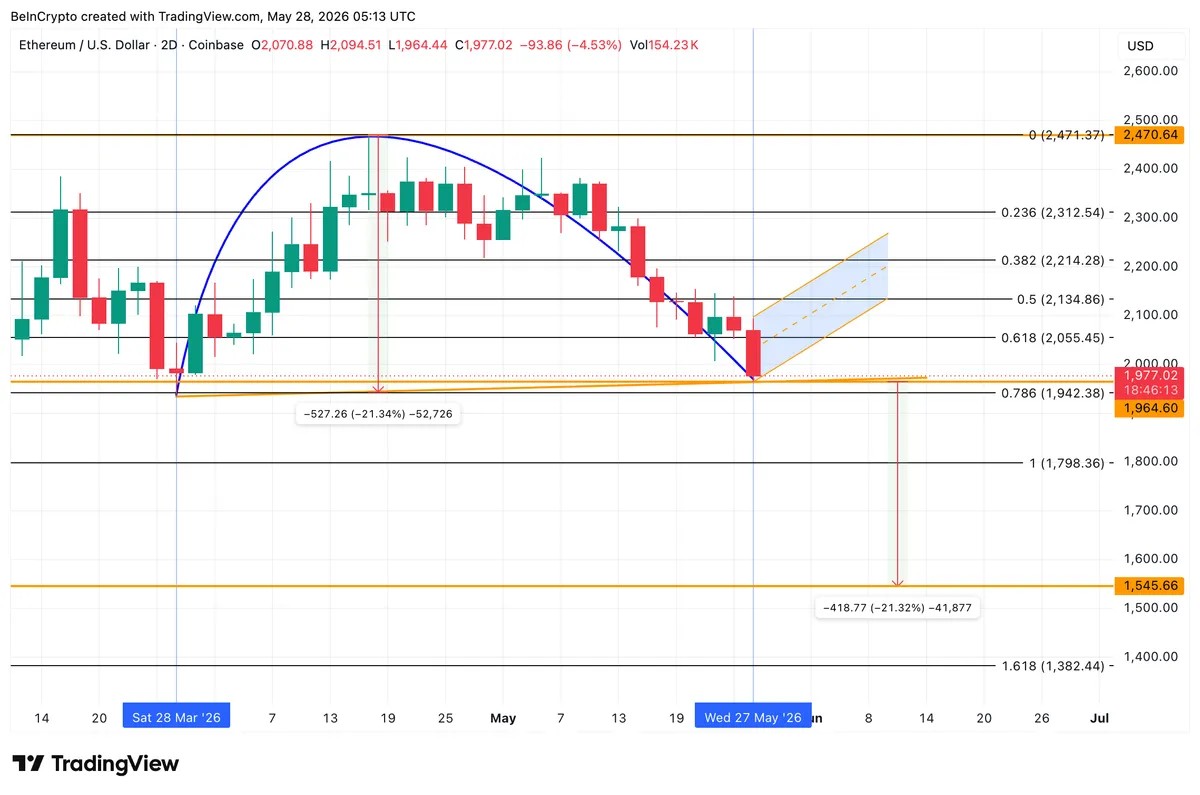
The downside is binary. $ETH must hold the trendline at $1,964 for the rebound case to survive. A two-day close below $1,964 confirms the inverted cup-and-handle breakdown, projecting a 21% measured move to $1,545.
The 1.0 Fib at $1,798 is the only stop on the way down. Ethereum price holds $1,964 and June sees a relief bounce into the $2,055 to $2,134 cost basis ceiling. If $ETH loses $1,964, then June possibly targets $1,545.
The post Ethereum Price Prediction: What To Expect From $ETH in June 2026 appeared first on BeInCrypto.