
Ethereum is back near a key support zone after a short term breakdown sent $ETH toward the $2,030 area. Buyers need to defend the $2,000 zone, while a move above $2,130 would give $ETH its first stronger recovery signal.
Ethereum Price Holds Support as $ETH Tests Buy Order Block
Ethereum is testing a buy order block on the 1 day chart after pulling back from the May resistance area. The chart shared by The Great Mattsby on X shows $ETH holding near the green support zone around the $2,000 to $2,070 area.
The setup shows price moving between clear buy and sell order blocks. The nearest support is the green zone under the current price area. If $ETH holds that zone, buyers could try to defend the structure and push price back toward the first resistance band.
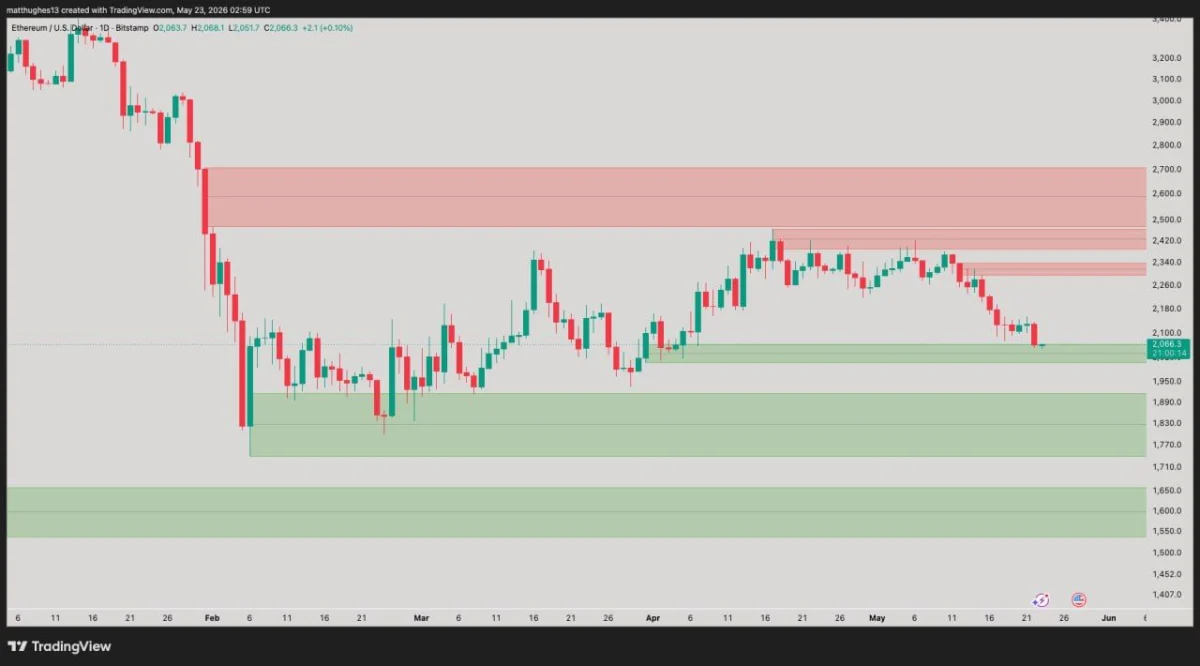
$ETH Buy Order Block Chart. Source: The Great Mattsby on X
The first sell order block sits around the $2,260 to $2,340 area. $ETH rejected from that region earlier in May, so it remains the nearest upside test.
A stronger move would need to clear the next resistance area near $2,420 to $2,700. That wider red zone marks the larger supply area from the earlier breakdown.
However, the current support zone matters first. If $ETH loses the buy order block near $2,000, the chart points to the next major green support area around $1,770 to $1,890.
A deeper drop could bring the lower support zone near $1,550 to $1,650 back into focus. That would weaken the recovery structure and show that sellers still control the larger range.
For now, $ETH is sitting at a key decision point. The chart shows support under price, but buyers still need a move back above the nearby sell order block to confirm stronger momentum.
Ethereum Price Drops as $ETH Short Setup Hits 5% Target
Ethereum fell after breaking below a short term rising trendline on the 1 hour chart. The chart shared by Cryptorphic on X shows $ETH dropping from the $2,130 area toward the $2,030 zone after a failed recovery attempt.
The setup started near a resistance area around $2,130 to $2,159. $ETH tried to hold that level, but sellers pushed price below the rising support line. That break confirmed weaker momentum and opened the way for the short setup shown on the chart.
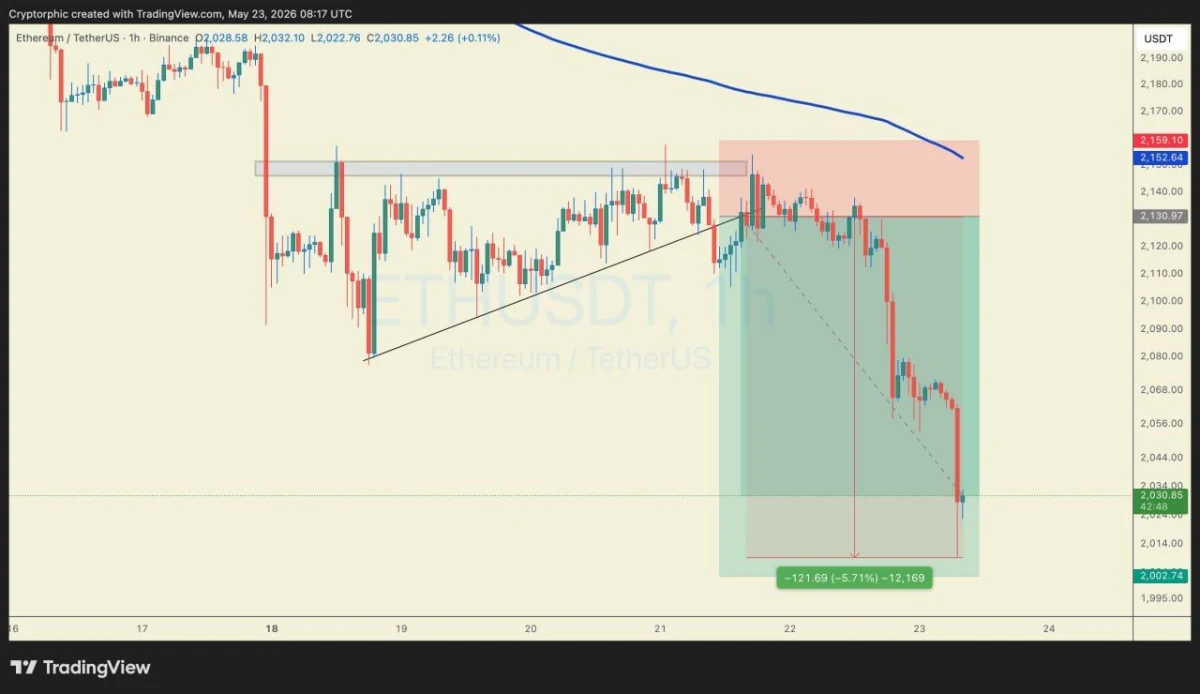
$ETH Short Setup Chart. Source: Cryptorphic on X
The chart marks a decline of about 5%, with the move extending toward the lower target area near $2,002. $ETH was still trading above that lower target zone, but the sharp drop showed that sellers controlled the move after the breakdown.
The blue moving average above price adds another resistance layer. $ETH remains below that line, which means buyers still need a stronger recovery before the short term trend improves.
The first key support now sits near $2,030, followed by the larger $2,000 area. If $ETH loses that zone, the chart points toward deeper downside pressure.
For recovery, $ETH needs to reclaim the $2,130 area first. A move above $2,159 would weaken the bearish setup and show that buyers are taking back control.