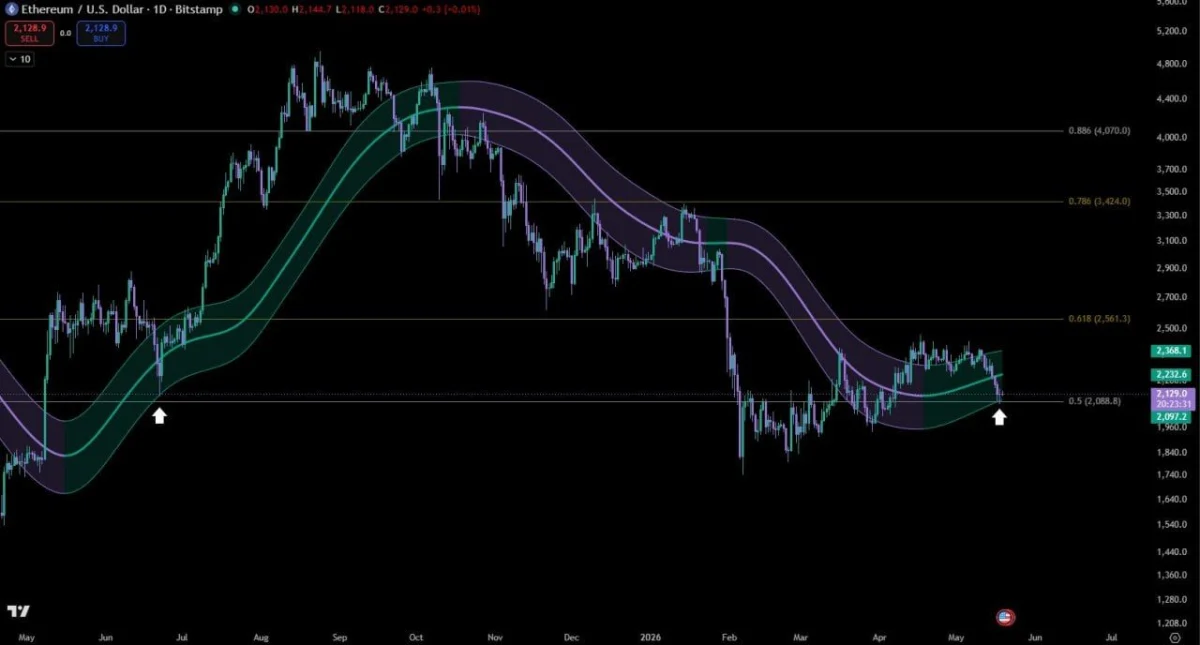
$ETH/USD Daily Price Chart. Source: Sky on X
The chart also shows the Gaussian Channel has flipped from purple to green. That shift usually marks improving trend conditions after a long bearish phase. $ETH is now sitting near the lower part of that green channel, where the analyst marked a possible bounce area.
The last similar setup appeared in mid-2025. At that time, $ETH bounced from the green Gaussian Channel and later climbed from around $2,100 to more than $4,900.
However, $ETH still needs to hold above the $2,088 Fib level to keep this bullish setup active. A daily close below that area would weaken the bounce structure and put the lower channel support near $2,097 in focus.
If $ETH holds this zone, the next upside levels sit near $2,561, which marks the 0.618 Fib level, and $3,424, which marks the 0.786 Fib level. A stronger move above those levels would bring the wider recovery setup back into focus.
For now, Ethereum price remains at a decision point. The chart supports a bullish bounce only as long as $ETH stays above the 0.5 Fib level and the green Gaussian Channel support.
Ethereum Chart Points to Long Cycle Setup With $15K Target
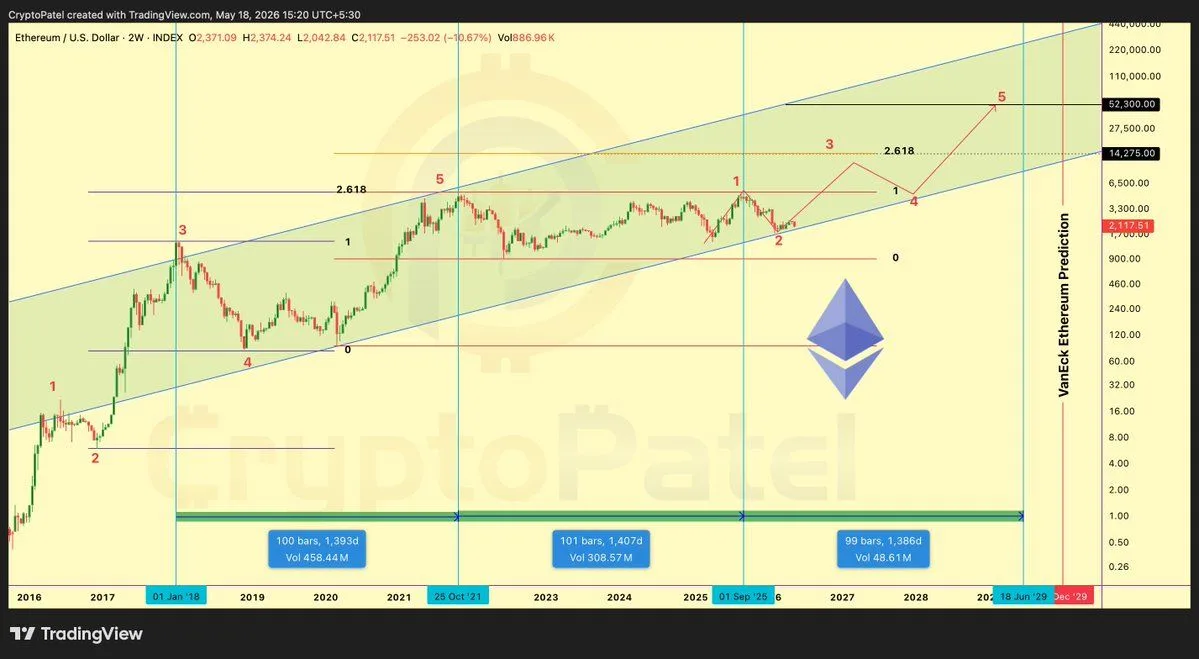
Ethereum is trading inside a long-term ascending channel on the two-week chart shared by Crypto Patel on X, with the analyst marking a possible move toward the $14,275-$15,000 area in the next cycle.
The chart uses a long time frame from 2016 to 2029. It shows $ETH moving through repeated cycle waves, with major peaks marked as wave 3 and wave 5.
The first major cycle topped near the 2018 peak. After that, Ethereum corrected into 2020 before starting another large move.
$ETH/USD 2-Week Cycle Chart. Source: Crypto Patel on X
The second cycle reached its wave 5 peak in 2021. Then $ETH entered a long correction and moved back toward the lower half of the ascending channel.
The current structure shows Ethereum near the lower channel support again. Crypto Patel marks this area as wave 2, which means the chart treats the recent weakness as part of a larger bullish cycle setup.
The projected path shows $ETH moving toward wave 3 first, then pulling back into wave 4. After that, the chart points to a possible wave 5 move toward the upper Fibonacci extension area.
The main upside levels on the chart are the 2.618 extension near $14,275 and the higher marked zone near $52,300. However, the written claim focuses on the $15,000 area, which sits close to the $14,275 Fibonacci level.
This setup depends on Ethereum holding the long-term ascending channel. If $ETH breaks below that structure, the cycle projection would weaken.
For now, the chart does not show a confirmed breakout. It shows a long-term roadmap where Ethereum needs to hold support first, then reclaim higher resistance zones before the $15,000 target becomes active.

 coinpaper.com