
Ethereum is under short-term pressure after losing a key rising trendline, while another chart shows a possible bullish reversal pattern forming.
The latest $ETH setups show a split market: bears are trying to push price into a deeper C-wave, but bulls still need one strong breakout to confirm recovery.
Ethereum Faces Downside Pressure as $ETH Loses Short-Term Trendline
Ethereum is trading under short-term pressure after losing the rising support line on the 4-day chart, while analysts still leave room for a broader B-wave bounce.
The $ETH/USD chart shared by More Crypto Online shows Ethereum near $2,108 after price failed to hold the small rising structure that formed from the April low. The breakdown puts sellers back in control in the short term.
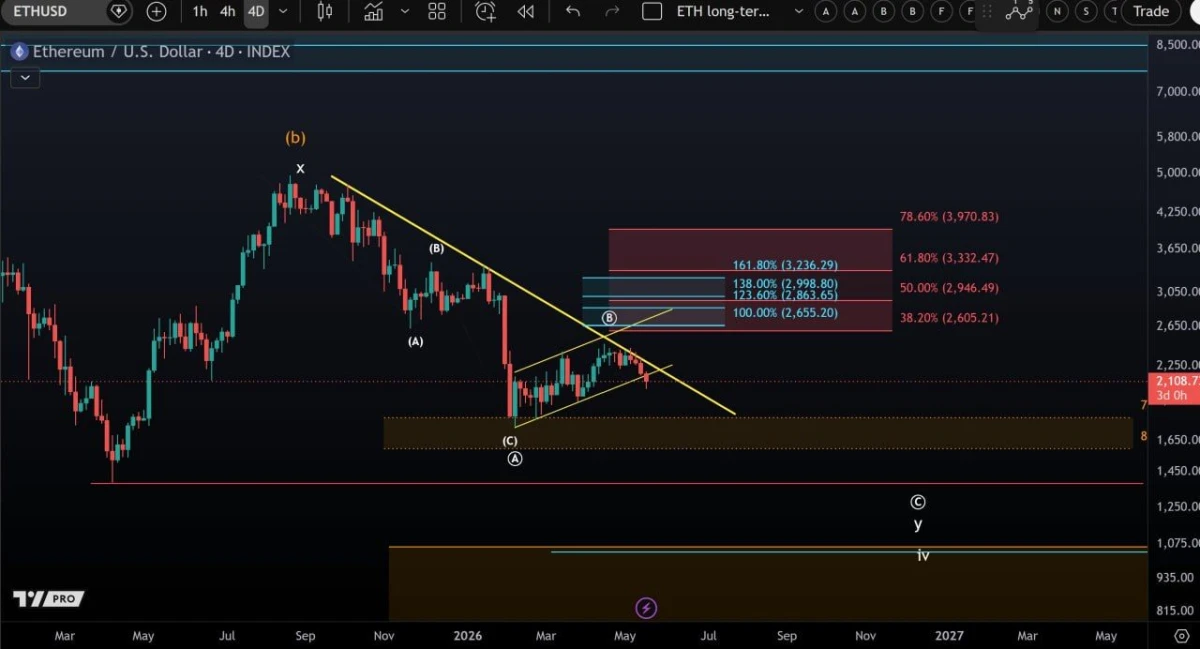
Ethereum C-Wave Downside Setup. Source: More Crypto Online on X
The chart also shows $ETH trading below a larger descending trendline that started from the previous high near the $4,700–$5,000 area. Ethereum tried to recover into that trendline but failed to break above it.
The analyst said bears are trying to start the C-wave to the downside. However, the decline from the April high still appears to have only three waves, which means Ethereum could still form a more complex B-wave bounce before a deeper move develops.
The main upside zone sits between $2,655 and $3,236. This area includes the 100%, 123.6%, 138%, and 161.8% Fibonacci extension levels. Above that, the broader retracement levels mark $3,332 and $3,970 as higher resistance areas.
However, $ETH must first recover above the broken short-term structure and the descending yellow trendline. Without that move, the chart keeps short-term pressure pointed lower.
On the downside, the chart shows a major support zone near $1,650–$1,800. A deeper bearish continuation could bring that area back into focus if $ETH fails to reclaim the $2,200–$2,300 region.
For now, Ethereum remains below key trend resistance. The chart does not fully confirm a larger downside C-wave yet, but short-term momentum has turned weaker.
Ethereum Bullish Reversal Pattern Starts Forming
Meanwhile, another $ETH chart points to a possible bullish reversal pattern forming after the recent downside pressure.
Ray said Ethereum may be building a new bullish reversal setup. The post suggests $ETH could be shifting from a weak short-term structure into a recovery pattern, although confirmation would still depend on a clean breakout above the pattern’s resistance area.
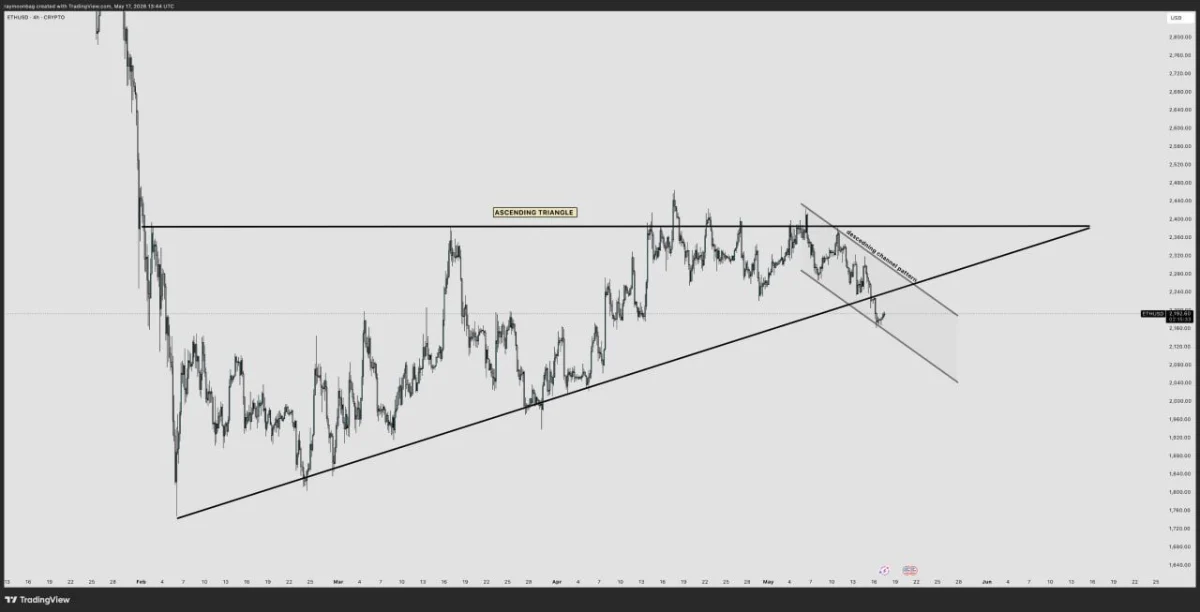
Ethereum Bullish Reversal Pattern. Source: Ray on X
This adds a second angle to the $ETH setup. The earlier chart showed sellers trying to start a C-wave lower, while this view points to a possible reversal forming before deeper downside gets confirmed.
For now, the bullish case needs stronger follow-through. If $ETH breaks above the reversal structure, buyers could regain control and push price back toward the next resistance zones. If the pattern fails, the short-term downside setup remains active.