
Ethereum moved back above a key weekly moving average for the first time since October 2025, putting its recovery setup back in focus. At the same time, the monthly chart shows $ETH still holding inside a long term rising channel, keeping the wider upside structure active.
Ethereum Weekly Close Above Moving Average Puts $ETH Recovery Back in Focus
Ethereum closed the week near $2,327, moving slightly above the blue moving average line on the weekly Coinbase chart. Sky said this was the first weekly close above the 20-day moving average since October 2025.
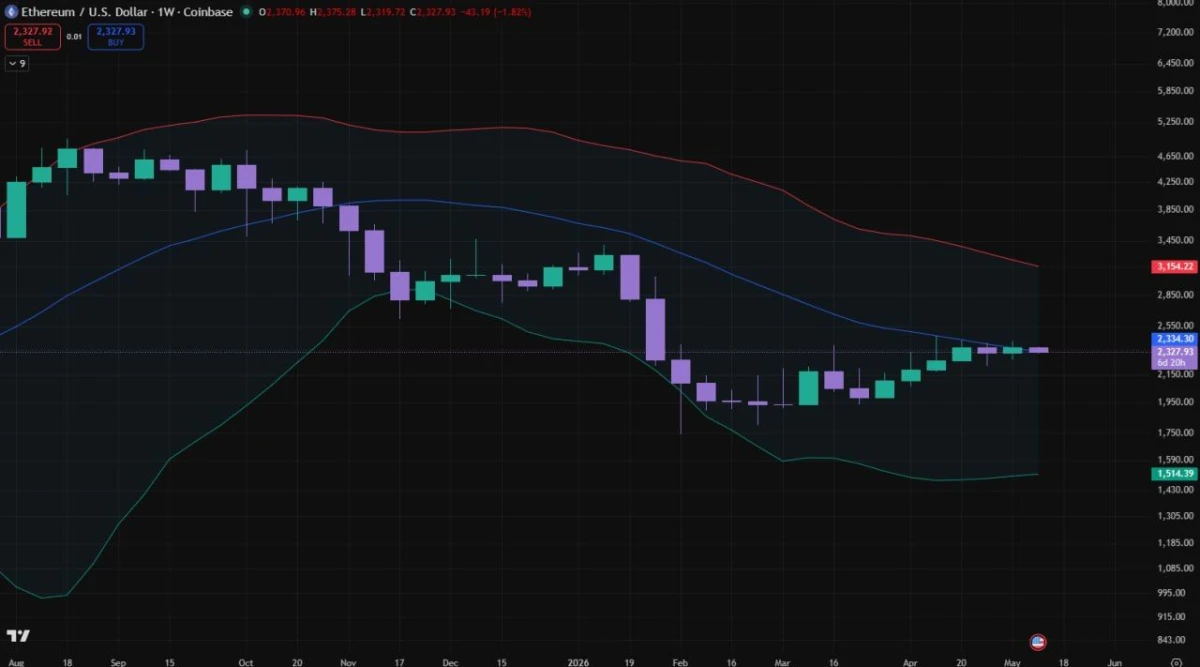
Ethereum Weekly Close Above Moving Average. Source: Sky on X
The chart shows $ETH recovering from its February and March lows near the $1,750 to $1,950 area. Since then, price has formed a steady rebound and returned to the $2,300 zone.
This close matters because moving averages often act as trend filters. When price closes above a key average, traders may read it as a sign that momentum is improving. However, $ETH still trades below the higher red moving average near $3,154, which remains a major resistance area.
Sky compared the move with the previous breakout in October 2025, when $ETH later climbed from around $2,400 to $5,000. That comparison adds attention to the current setup, but $ETH still needs stronger follow-through to confirm a larger trend shift.
For now, the $2,300 to $2,350 area is the key short-term zone. If $ETH holds above it, the next upside focus may shift toward the $2,550 and $2,850 levels. However, a drop back below the moving average could weaken the recovery and return focus to the $2,150 support area.
Ethereum Long Term Channel Keeps $ETH Upside Structure in Focus
Ethereum traded near $2,332 on the monthly Bitstamp chart, while price continued to hold inside a large rising channel that stretches from the 2016 lows toward the projected 2031 area.
The chart from The Great Mattsby shows $ETH moving “up and to the right” inside the long term structure. The lower trendline has acted as the main support line across several cycles, while the upper trendline marks the wider upside boundary.
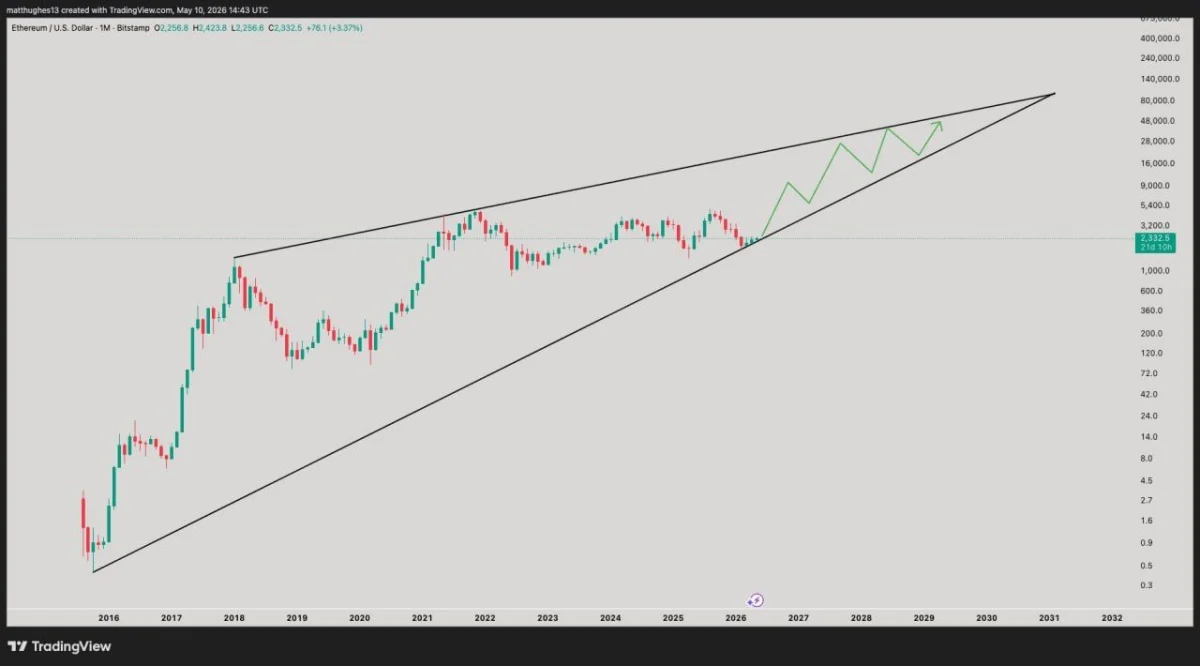
Ethereum Long Term Rising Channel. Source: The Great Mattsby on X
$ETH is now near the lower half of the channel after years of sideways movement between roughly $1,500 and $4,800. That means price has not broken the long term structure, even though it remains far below its previous high.
The green path on the chart shows a possible continuation move toward higher levels in 2026, 2027, and later years. However, this is a projected path, not confirmed price action.
For now, the main level to watch is the lower channel support. As long as $ETH holds above that rising line, the long term bullish structure remains active. A break below it would weaken the setup and challenge the broader upside view.