
Ethereum is still stuck below the $2,400 area, but higher time frame charts show a wider bullish setup forming. $ETH now needs to clear moving average resistance before the $4,900 target comes back into focus.
Ethereum Struggles Below $2.4K as $ETH Range Stays in Play
Ethereum remained below the $2,400 area on the weekly chart as price struggled to break above a major moving average zone, according to a TradingView chart shared by Daan Crypto Trades on X.
The chart shows $ETH trading inside a wider range between about $2,100 and $2,800. Price has recovered from its earlier low near the $1,750 area, but it has not cleared the upper moving average resistance.
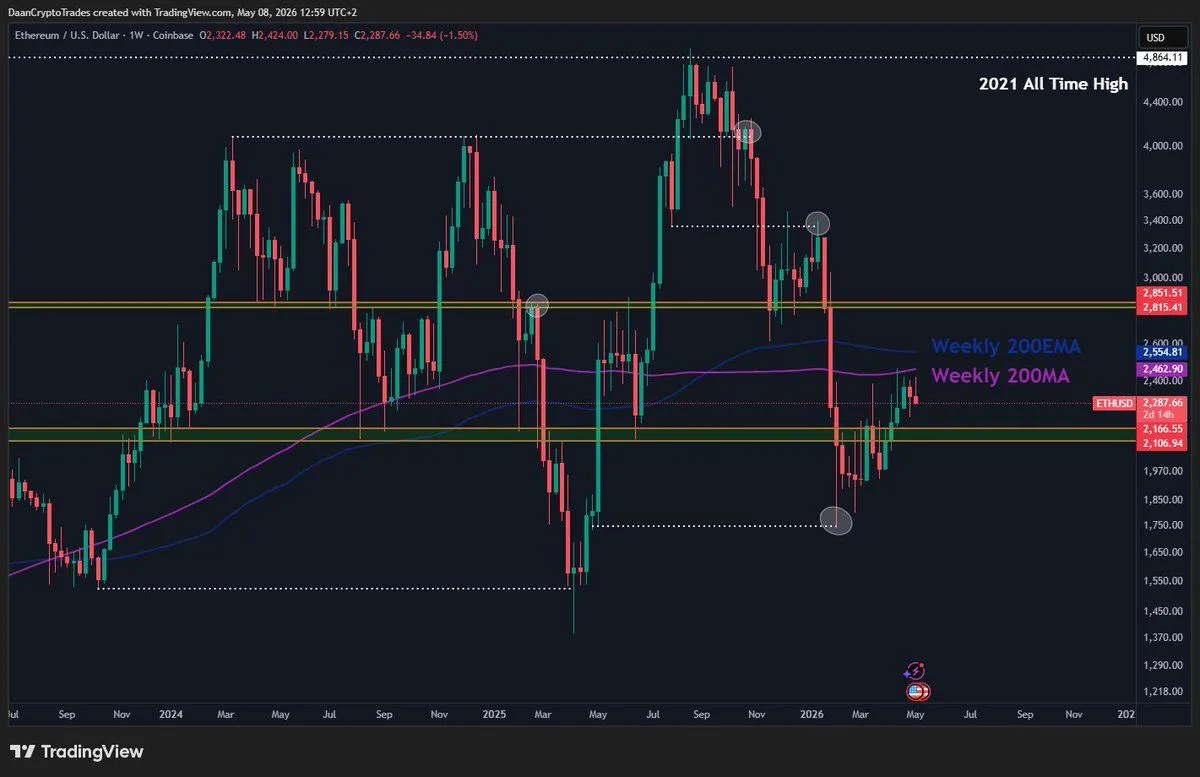
$ETH Weekly 200MA and 200EMA Range. Source: Daan Crypto Trades on X
The weekly 200MA and weekly 200EMA sit above the current $ETH price zone. These moving averages remain important because they often act as resistance when price trades below them.
However, $ETH still holds above the lower part of the marked range. The $2,100 to $2,166 area acts as near term support, while the $2,815 to $2,851 area marks the upper resistance zone.
For now, Ethereum remains range bound. A move above the $2,400 area would put the weekly 200MA and 200EMA back in focus, while a drop below $2,100 would weaken the current recovery structure.
Ethereum Chart Points to $4,900 as $ETH Forms Right Shoulder Setup
Ethereum formed a large inverse head and shoulders structure on the three day chart, according to a TradingView chart shared by Ray on X.
The chart shows $ETH building a long term base above an ascending support trendline. The left shoulder formed after the 2025 pullback, while the head formed near the lower support area in early 2026.
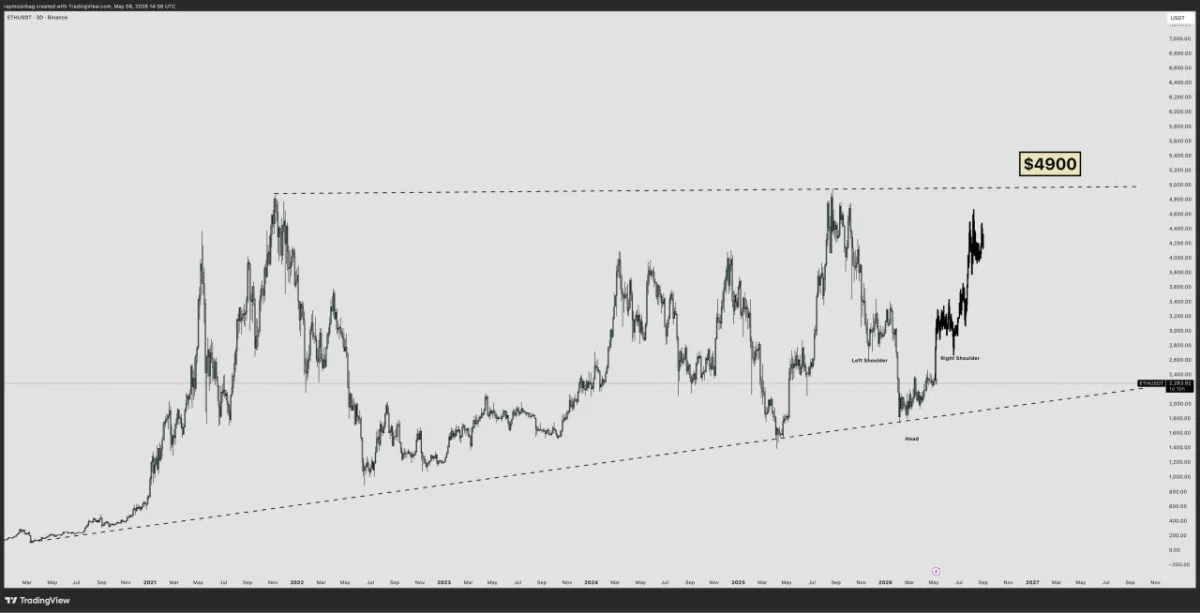
$ETH Inverse Head and Shoulders Setup: Source: Ray on X
Since then, $ETH has recovered and moved into the right shoulder area. This structure often appears when buyers regain control after a long correction.
The main target on the chart sits near $4,900. That level aligns with a horizontal resistance area from Ethereum’s previous cycle highs.
However, $ETH still needs to continue higher and challenge the upper resistance zone before the setup can fully confirm. A rejection before that area would keep the pattern incomplete.
For now, the chart shows Ethereum holding its broader recovery structure. The key focus remains whether buyers can push $ETH toward the $4,900 resistance level.