cryptopotato.com

Ethereum continues to trade within a broader consolidation structure as the market struggles to establish sustained bullish momentum. Nevertheless, weakening momentum indicators and growing signs of seller activity suggest that the market could be preparing for another corrective move in the short term.
Ethereum Price Analysis: The Daily Chart
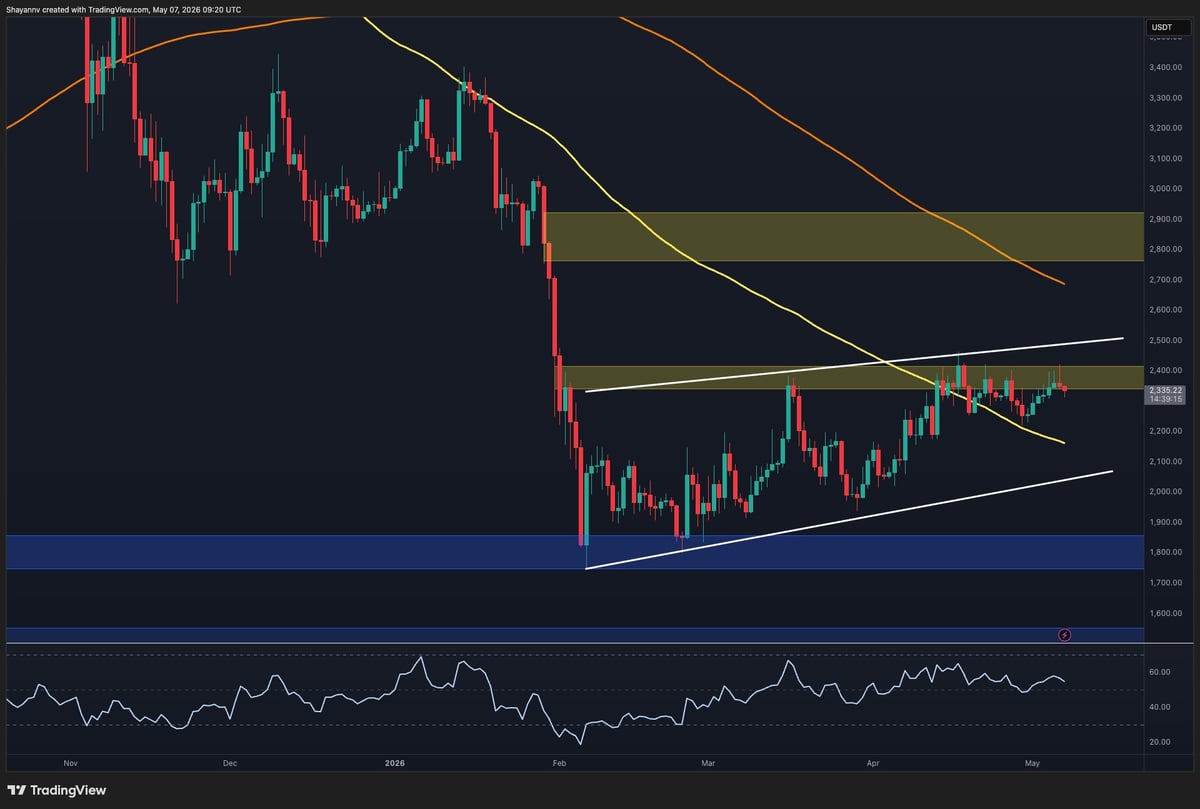
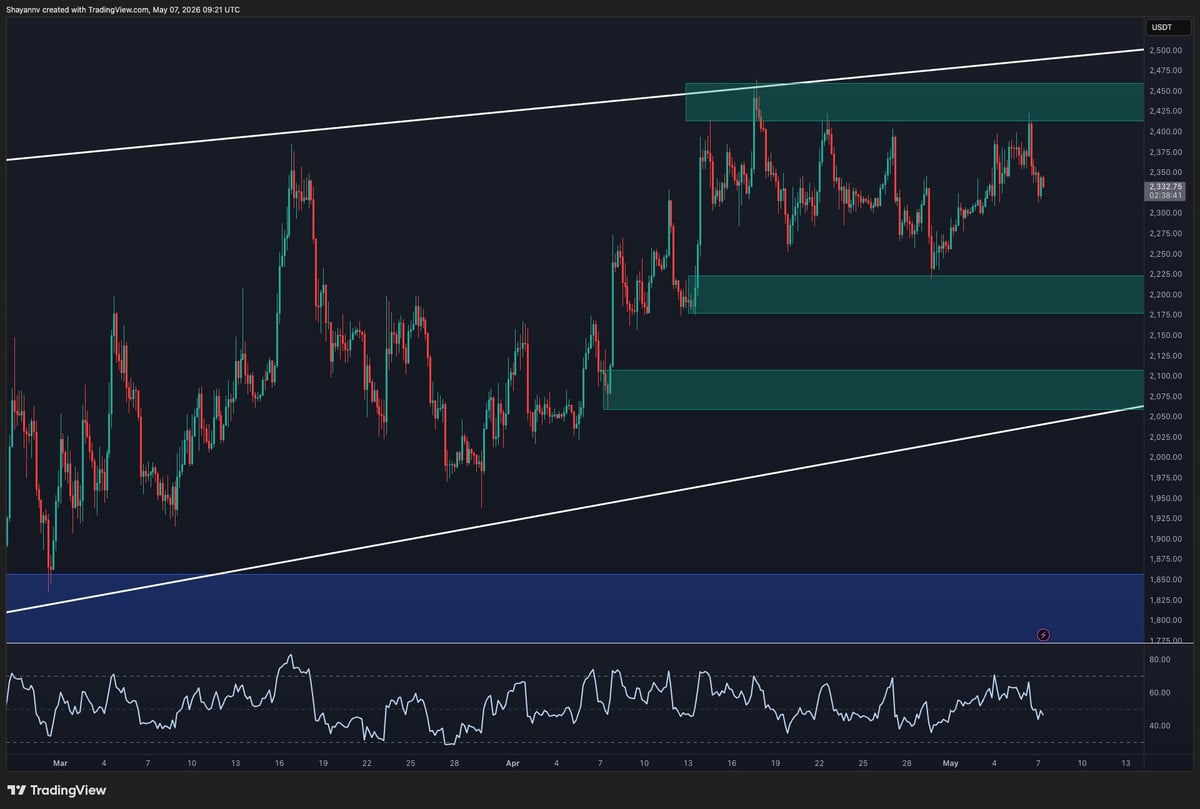
On the daily timeframe, $ETH is showing a notable bearish divergence between the RSI indicator and price action. While the asset recently attempted to stabilize near the $2.3K-$2.4K region, the RSI has been forming lower highs, signaling weakening bullish momentum beneath the surface. At the same time, the recent price action has become increasingly choppy and indecisive, further highlighting the presence of sellers around the current levels.
This combination of bearish divergence, weakening momentum, and unstable price behavior increases the probability of a downward move toward lower support zones in the coming days. If such a decline unfolds, the 100-day moving average around the $2.2K region will likely become the next important defensive line for buyers. A loss of this level could expose Ethereum to deeper corrections toward the broader $2K support range.