cryptopotato.com
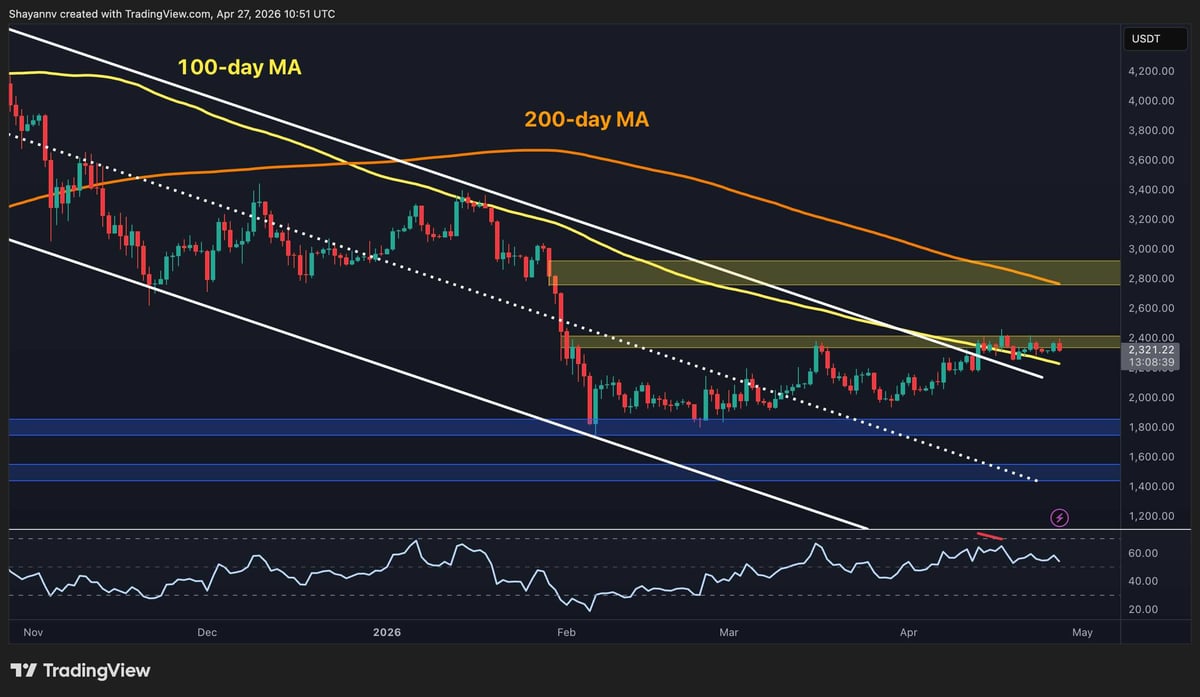
Ethereum is trading above $2.3k as April draws to a close, ending the month in a frustratingly familiar position. It is pressing against the same $2.4k resistance zone it has now tested repeatedly since mid-March without a clean resolution. $ETH sits at the threshold of what could either be its most significant breakout in months or yet another rejection at the gate.
Ethereum Price Analysis: The Daily Chart
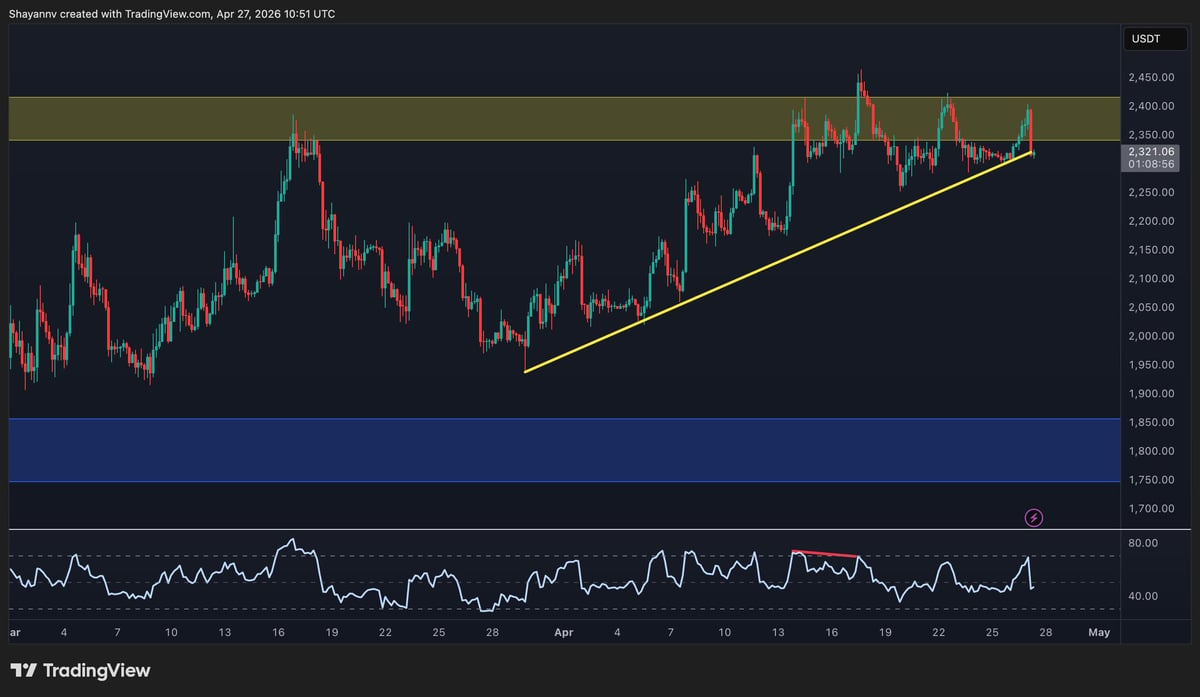
What has genuinely changed on the daily chart over the past four weeks is not the resistance. The $2.4k zone has held firm throughout. Yet, each recent pullback has found support at a higher level, first the $2k area, then $2.1k, and now the higher trendline of the broken channel and the 100-day moving average around $2.2k are the support elements to keep an eye on. The sequence of higher lows, sustained over multiple weeks, represents quiet accumulation building beneath a stubborn ceiling.
The RSI also remains in the high-50s, which is not the kind of momentum collapse that has preceded prior failed breakouts, but still not showing enough strength for another push toward $2.4k. If the market fails to break above the mentioned level, the 100-day moving average would be the first downside target, and if it fails to hold, the price could fall all the way back below $2k and toward the critical $1.8k area that began this mild recovery.