
Ethereum is showing two different signals at the same time. On the weekly chart, a MACD cross is echoing a 2022 setup that came before a sharp drop, while on the 4-hour chart, the short-term structure stays bullish as long as $2,027 holds.
$ETH MACD Cross Mirrors 2022 Setup, but the Signal Still Needs Confirmation
The chart shows a weekly ETHUSD view on Coinbase with the MACD turning up after a long decline. Ted Pillows argues that this kind of bullish MACD cross during a broader downtrend can mark a local top, not a fresh breakout. He points to a similar setup in 2022, when $ETH posted a bullish cross and then dropped sharply.
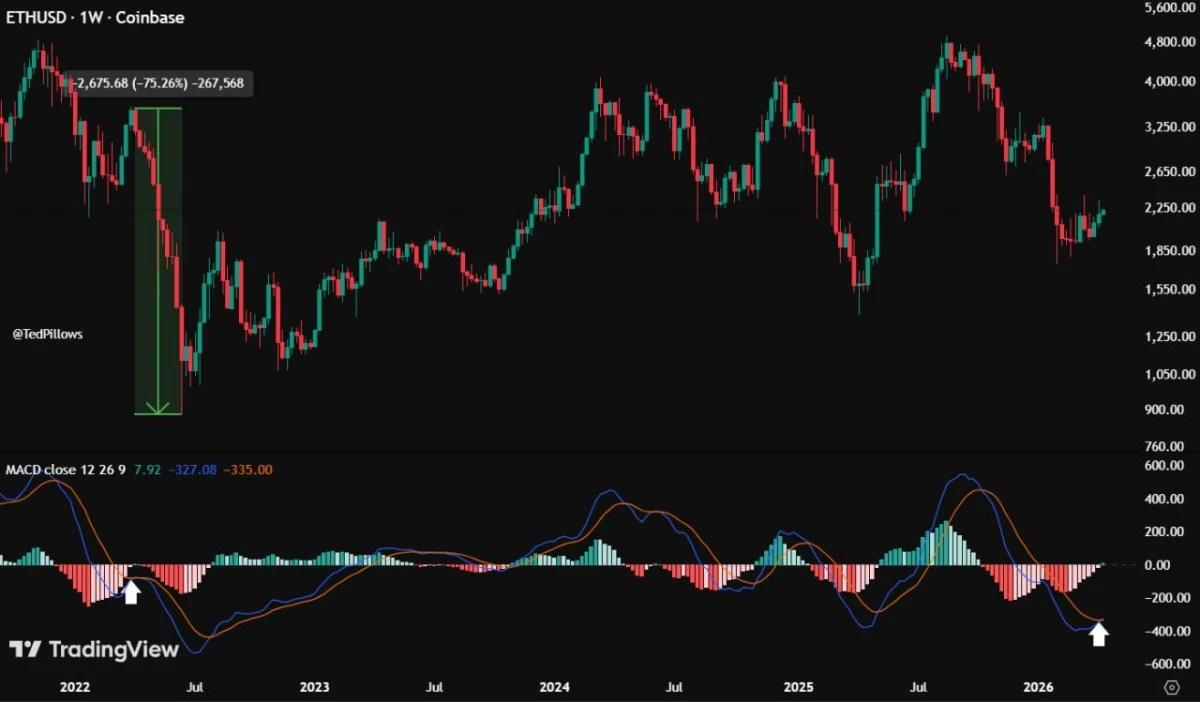
ETHUSD 1W Chart With MACD Bullish Cross Comparison. Source: Ted Pillows on X
On this chart, the comparison is clear. In 2022, $ETH formed a bullish MACD cross after a sustained fall. However, price did not start a lasting recovery. Instead, it rolled over and sold off hard. The green box on the left highlights that decline, which measured about 75%.
Now the same type of MACD turn is appearing again on the right side of the chart. The histogram is improving, and the MACD line is trying to cross above the signal line from deeply negative levels. Still, price remains far below the previous cycle highs and continues to trade inside a broader weak structure on the weekly timeframe. So the cross alone does not prove trend reversal.
That matters because MACD is a momentum indicator, not a standalone trend confirmation tool. In strong downtrends, bullish crosses often reflect short-term relief rather than a full change in market direction. Therefore, traders usually look for more proof, such as higher highs, stronger weekly closes, and recovery of key resistance levels.
In this case, the chart supports a cautious reading. $ETH has bounced from lower levels, but it has not yet shown the kind of sustained strength that would invalidate the comparison with 2022. As a result, the current MACD cross may signal temporary upside first, while still leaving room for another rejection if broader trend weakness stays in place.
$ETH Holds Bullish Structure Above $2,027 as Upside Correction Stays Active
Meanwhile, This 4-hour ETHUSD chart shows Ethereum moving in a corrective upside structure that MCO Global says is similar to Bitcoin’s recent setup. Price has pushed into the $2,360 area and is testing a key horizontal resistance zone while still trading below a descending trendline. That means the rally remains active, but it is also approaching a decision area.
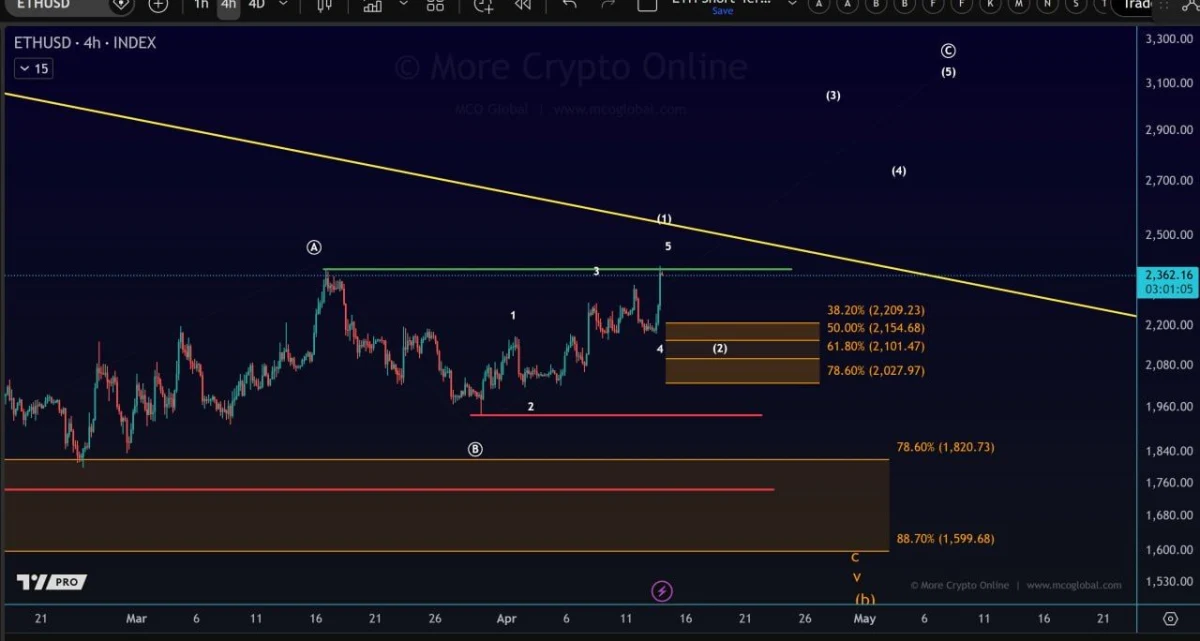
ETHUSD 4H Corrective Structure With Key Support at $2,027. Source: MCO Global on X
The chart maps a five-wave move higher inside a broader corrective pattern. It also marks a possible pullback zone between about $2,209 and $2,027, based on Fibonacci retracement levels. According to the setup, that area could serve as the next support region if $ETH pulls back after the recent rise. The most important level in that zone is $2,027.
As long as $ETH stays above $2,027, the current structure remains intact. In that case, the chart suggests the larger upside correction can continue, even if price first dips from current levels. However, $ETH is now trading near horizontal resistance around $2,362 and under the falling trendline, so rejection remains possible before any further extension.
If $ETH breaks below $2,027, that would weaken the current bullish corrective count. Then focus would likely shift to deeper downside levels shown on the chart, including the larger support region near $1,820 and $1,599. For now, though, the setup stays constructive while $ETH holds the marked invalidation level.