
As the market moves into a new quarter, forecasts around Q2-end targets are starting to build.
To gauge potential direction, however, it’s important to look back. Q1 was bearish, with Bitcoin [$BTC] closing down 22.2%, its worst quarterly performance since 2018.
Ethereum [$ETH], meanwhile, ended the quarter down 29.36%, though still an improvement over Q1 2025’s 45.41% losses.
However, if we take the 2025 cycle as the base case, Ethereum’s 36.48% Q2 rally outperformed Bitcoin by roughly 1.2x, highlighting $ETH’s stronger rebound. That said, a recent CryptoQuant report suggests this trend may already be unfolding, with March leading the shift.
During the month, Bitcoin posted a marginal +1.83% gain, while Ethereum advanced +7.12%, indicating a clear rotation of capital.
Concurrently, Bitcoin’s market cap contracted slightly (-0.43%), whereas Ethereum expanded (+2.97%), reinforcing the narrative of capital shifting toward higher-beta assets.
Notably, this divergence is further validated in supply-side dynamics.
Ethereum’s continued exchange outflows, for instance, point to a gradual shift toward long-term holding. In addition, on-chain data further supports this: the Coinbase Premium Gap is improving, signaling early-stage recovery.
Meanwhile, Ethereum’s active addresses continue trending higher, indicating rising network usage.
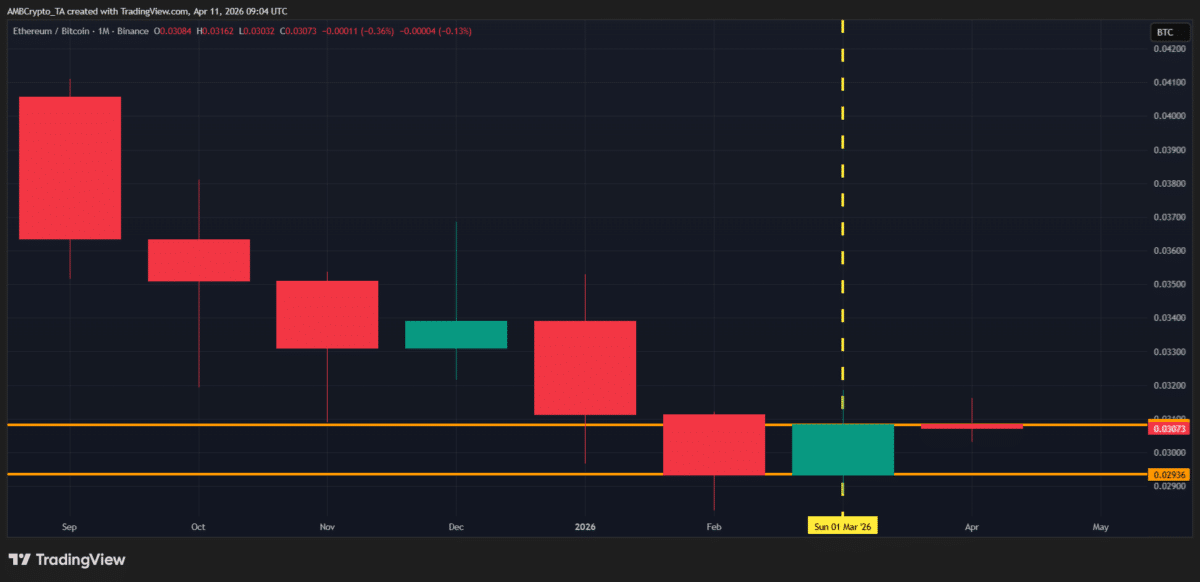
In essence, the $ETH/$BTC ratio climbing to 5.15% in March wasn’t a fluke. Instead, it was driven by a mix of rotational flows, tightening supply dynamics, and improving on-chain activity.
Naturally, this brings us to the key question – Is the setup now forming for Ethereum to outperform Bitcoin in Q2?
Institutional flows starting to catch up to Ethereum fundamentals
Ethereum’s strength isn’t always fully captured through short-term technical price action.
Instead, price tends to lag the underlying fundamentals. The logic is simple: In DeFi, increased network activity directly translates into higher demand for $ETH. However, this demand isn’t immediately reflected in price action.
Instead, it accumulates on-chain first before eventually being priced in by the market.
Looking at the recent CryptoQuant report, Ethereum appears to be moving closer to this phase. As shown in the data, the 7-day SMA of Ethereum’s ‘Total Transfer Count’ has once again broken above 1.3 million, revisiting levels last seen at the mid-February all-time high.
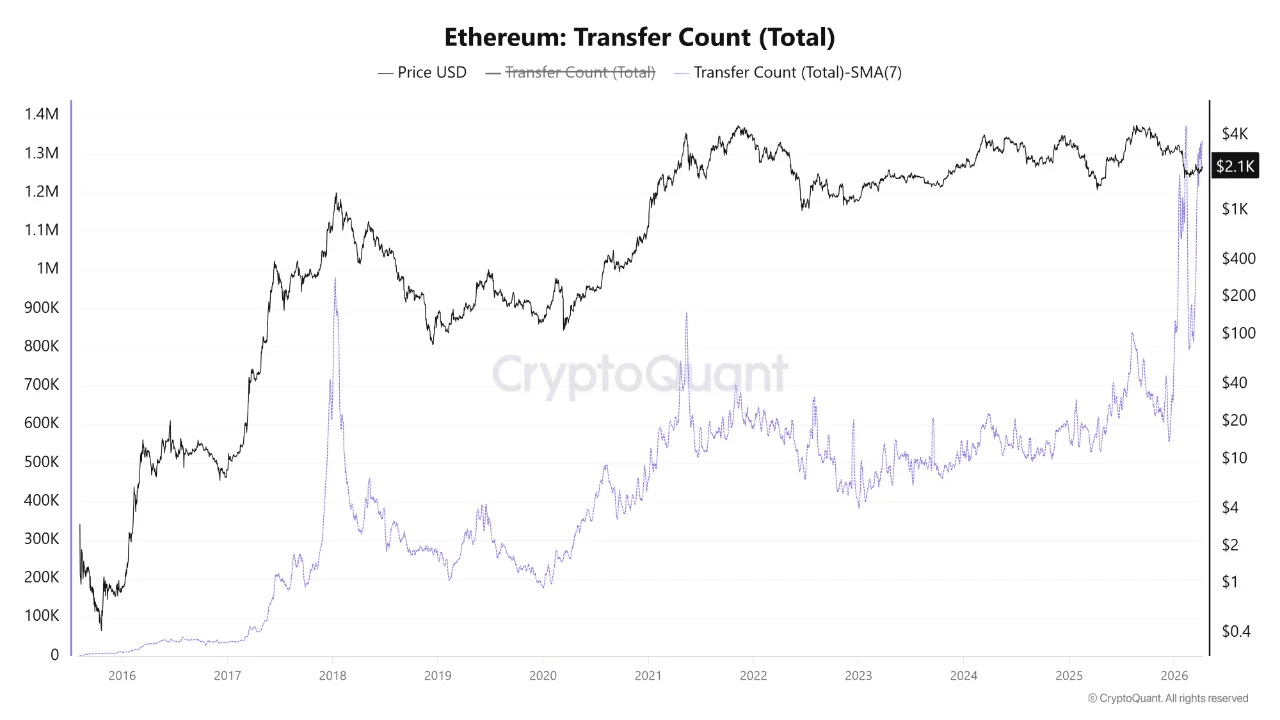
For context, a high 7-day SMA of ‘Total Transfer Count’ typically signals elevated on-chain activity, reflecting stronger usage across transfers, trading, and DeFi interactions.
More importantly, recent accumulation trends suggest institutional participation may be starting to catch up with this underlying network strength.
Now, when combined with the rising Coinbase Premium Index, increasing active addresses, and stronger capital flows observed in March, the picture becomes more constructive.
These indicators “collectively” point to on-chain demand, with both retail and institutional participation showing early signs of alignment.
Taken together, this suggests the early formation of a base for an $ETH/$BTC Q2 rotation, with Ethereum increasingly positioned to outperform Bitcoin into Q2-end.
Final Summary
- March capital rotation and improving $ETH/$BTC flows suggest an early-stage positioning shift toward Ethereum.
- Rising transfer activity, improving Coinbase Premium, and higher active addresses indicate strengthening on-chain demand, setting the stage for Ethereum outperformance in Q2.