Onchain data paints a mixed picture for Ether
$ETH is trading above $2,050 at press time, but onchain data paint a mixed picture for the top altcoin. Over the past week, investors across different cohorts have cracked under pressure.
According to the onchain data, wallets with a balance of 10K-100K, which have been major buyers throughout the recent downtrend, offloaded 340K $ETH between March 24-30.
However, the wallets flipped back to buying on Tuesday, scooping 270K $ETH across the past two days.
On the other hand, wallets with 100-1K and 1K-10K $ETH continued distribution, scaling down their holdings by roughly 200K $ETH over the past week.
In addition to that, US spot $ETH exchange-traded funds (ETFs) have also posted a similar trend. The ETFs have recorded only two days of inflows over the past two weeks of trading, indicating a bearish bias.
Ethereum Price Forecast: Bulls defend the $2k psychological level
The $ETH/USD 4-hour chart is bullish and efficient as Ether recorded its first monthly gain in six months.
At press time, $ETH is trading at $2,062. Its near-term bias remains mildly bullish as $ETH is trading below the 20- and 50-day Exponential Moving Averages (EMAs), which cap advances at around $2,080 and $2,160.
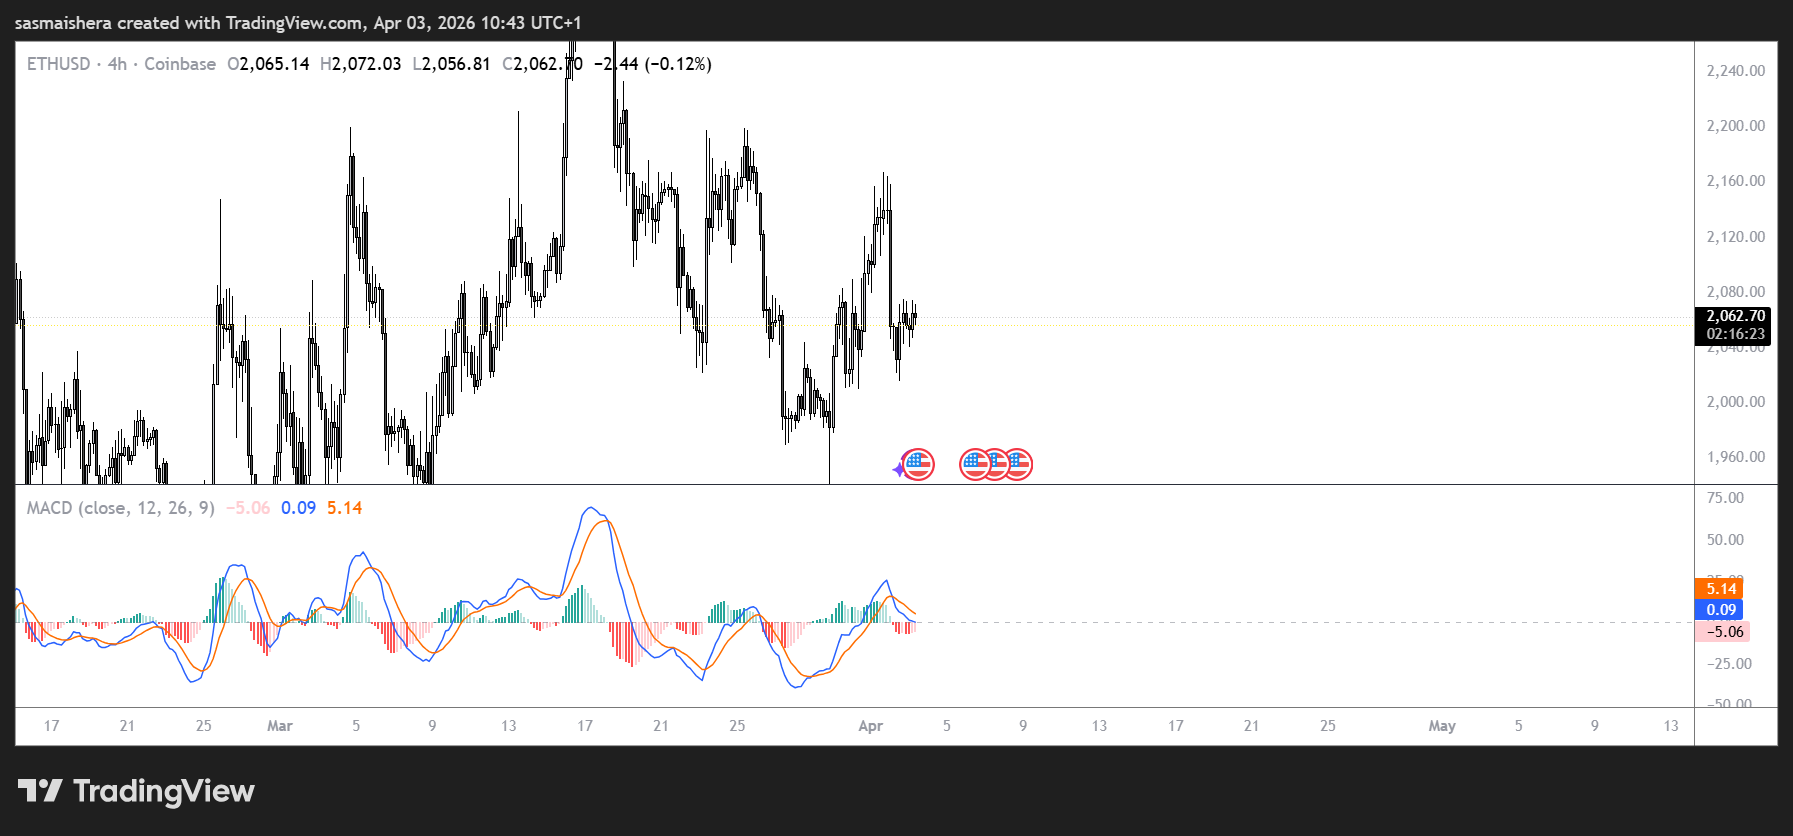
The Relative Strength Index (RSI) reads 53, slightly above the neutral level, while the MACD has stabilized around the midline, both indicating a growing bullish momentum.
If the recovery persists, the bulls would face immediate resistance at $2,108, followed by $2,389 and then $2,746. A daily close above $2,108 would be the first step to ease pressure and expose the higher resistance band toward the 100-day EMA and $2,389.
However, if the sellers regain control, $ETH would test the initial support at $1,911, followed by $1,741 and $1,524.
If $ETH continues to trade below $2,108, it risks drifting back toward the $1,700 area in the near term.

 coinjournal.net