cryptopotato.com
Ethereum’s recovery attempt is losing momentum again. The price is slipping back after failing to sustain strength near the key $2.4k resistance zone. The broader context remains a market trying to stabilize after a sharp downtrend, but repeated rejections on rallies and growing concerns over the war in the Middle East continue to highlight weak follow-through from buyers.
Ethereum Price Analysis: The Daily Chart
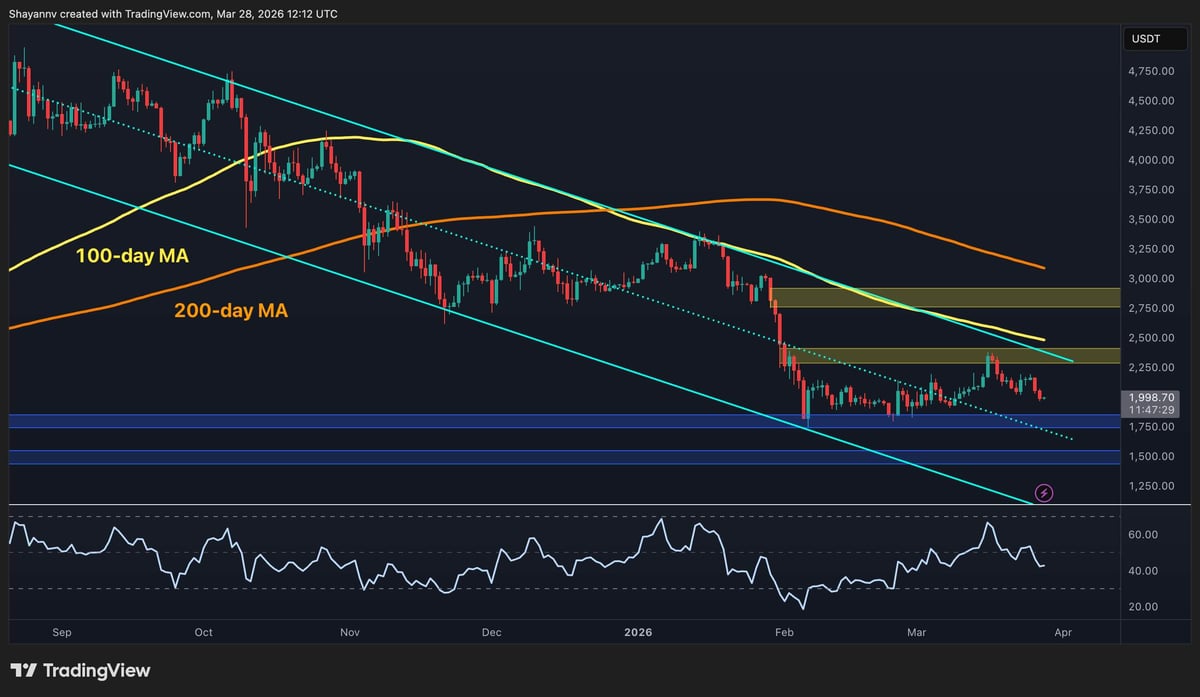
On the daily timeframe, $ETH remains firmly below the 100-day and 200-day moving averages, which are located around the $2.5k and $3.1k levels, respectively. Both moving averages are trending downward and acting as dynamic resistance overhead. The overall structure is also still characterized by lower highs, and the recent bounce has not been strong enough to break out of the descending channel pattern.
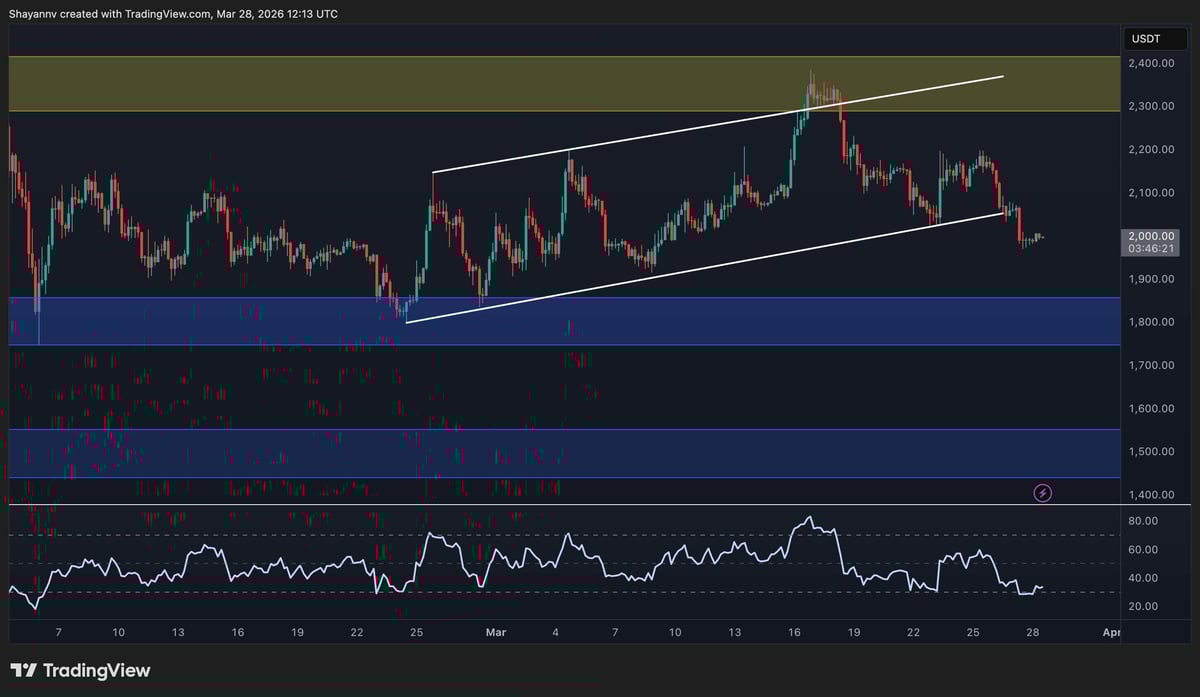
The price recently pushed into the $2.4k supply zone but failed to hold, reinforcing this region as a key resistance cluster. This area aligns with a bearish order block and continues to attract selling pressure. Therefore, as long as $ETH trades below it, the broader trend remains tilted to the downside, with the $1.8k support area being the most probable target for the market to visit in the coming days.