
- Two converging trendlines in the daily chart drive the ongoing consolidation trend in the $ETH price.
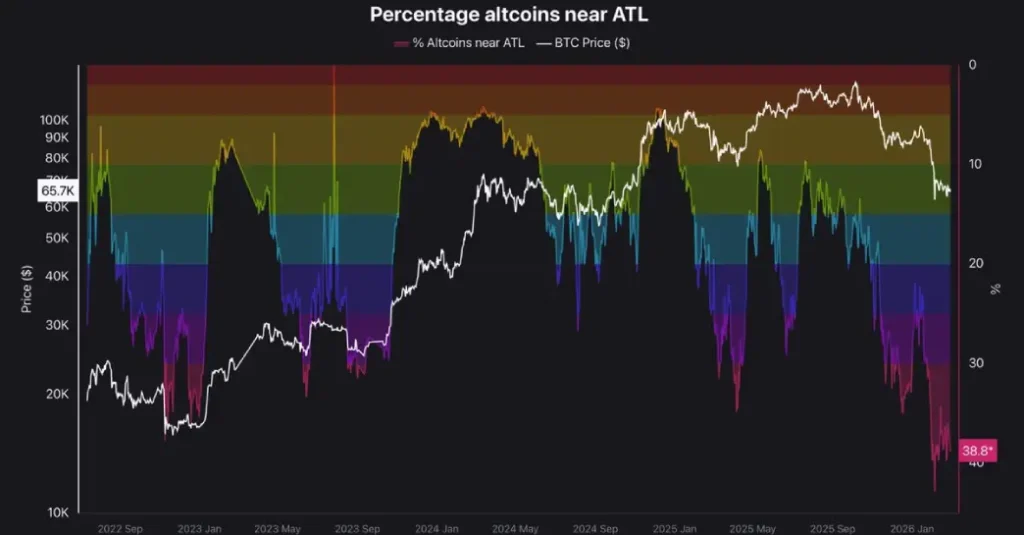
- A shared market chart highlights that nearly 38% of altcoins are trading near their historical lows.
- The relative strength index (RSI) is down to 52% suggests a neutral to bullish market sentiment.
On Tuesday, March 24th, the $ETH price projected a low volatility trading around the $2,150 mark, resulting in the formation of a neutral candle. This lack of recovery momentum can be attributed to renewed uncertainty surrounding the geopolitical tension in the Middle East. However, the latest on-chain data indicate that the altcoin market has plunged to the capitulation zone, suggesting an opportunity for trend reversal.
Altcoins Near All-Time Lows Signal Potential Market Bottom
The cryptocurrency market recorded a strong start to the week, which pushed the $BTC price above $70,000, while the $ETH price reclaimed $2,000. A primary catalyst for the surge was the de-escalation of the Middle East crises as President Donald Trump announced a progressive talk with Iran and a 5-day pause on any military action on Iran’s power infrastructure.
However, Iran has officially denied holding direct negotiations with the United States, reigniting the geopolitical tension among market participants. While the uncertainty surrounding the U.S.-Iran-Israel war continues to limit the growth potential of risky assets, the altcoin market presents an opportunity for reversal.
A chart highlighted by market analyst eyezenhour points out that almost 38% of altcoins are currently trading at or extremely close to their all-time lows. The visualization logs this metric over top of Bitcoin’s price trajectory from late 2022 to early 2026, with $BTC recently trading for close to $65,700.
Colored bands across the graph are various thresholds for the percentage of altcoins that are distressed, and a white line is drawn through Bitcoin’s many back-and-forth swings between peaks and troughs. The most recent reading is below the levels of the aftermath from the collapse of crypto exchange FTX in 2022, pointing to increased pressure on smaller tokens.
Market participants point out that such extremes often coincide with exhaustion in late stages: money moving in and out of assets, thin trading volumes picking off weak positions, and a general reset in trader exposure.
Similar clusters in previous cycles have occurred near major market foundation points, where the risk/reward relationship for long-term holders starts to shift more in the investor’s favour. Many experienced participants rely on regular, incremental purchases as their main method in these times.
$ETH Price Coiling In Narrow Range of Two Converging Trendlines
Over the past week, the $ETH price has plunged from $2,386 to $2,150, registering a loss of roughly 10%. The pullback signals a bearish reversal within the ongoing consolidation trend in the daily chart, coinciding with the broader market uncertainty.
However, a deeper analysis of the technical chart shows that a long-coming resistance trendline and an emerging support trendline have created new range boundaries for Ether. The $ETH price has already rebounded from these trendlines at least twice, signaling their influence on trading activity.
As Ethereum continues to follow a lateral path, its price is poised to challenge either of the trendlines for a major breakout, as per the Ethereum prediction.
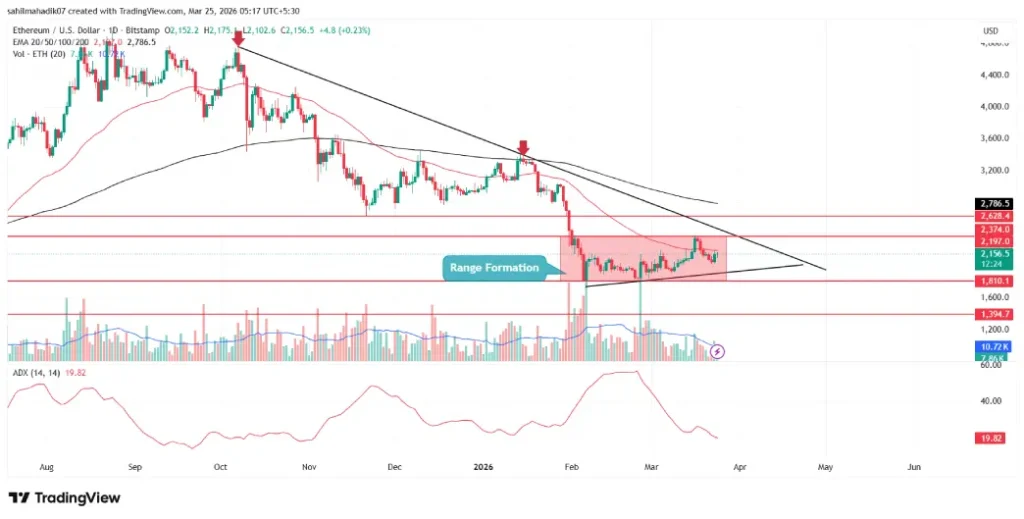
A bullish breakout from the pattern’s resistance trendline around $2,355 will intensify the buying pressure and drive a recovery towards $3,000.
On the contrary, if the Ethereum price breaks below the bottom trendline, the sellers strengthen their grip over the asset to drive a prolonged downtrend.