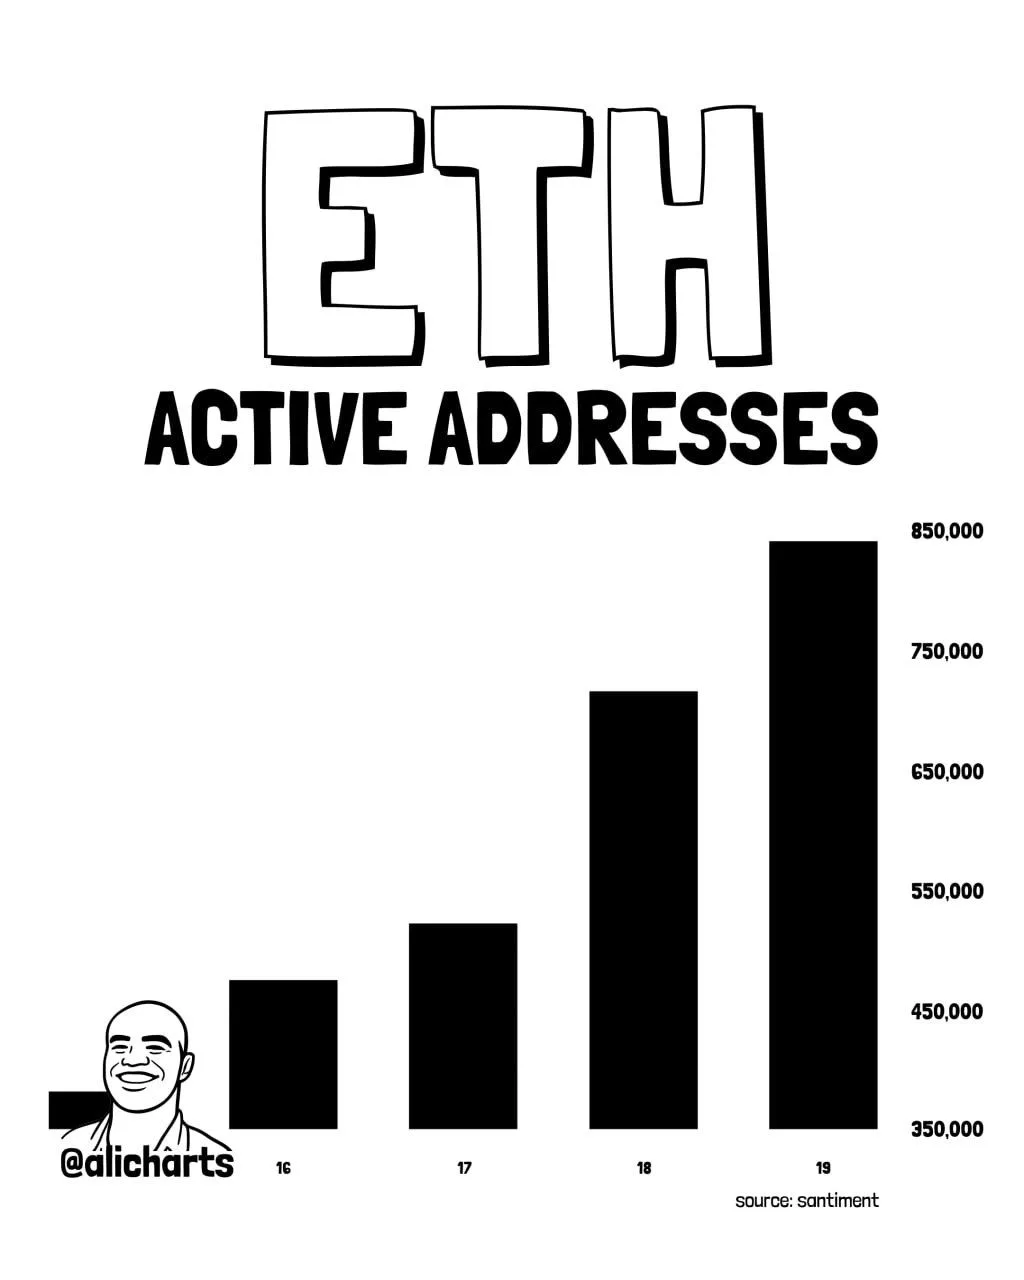
Ethereum Active Addresses. Source: Santiment via Ali Charts
Moreover, the move suggests more wallets interacted with the network through transfers, trading, DeFi activity, or other transactions. When active addresses rise this fast, it usually shows broader user participation rather than price action alone.
At the same time, this metric does not confirm whether the activity came from new users, returning users, or larger holders moving funds across wallets. Still, the scale of the increase shows Ethereum saw much heavier network usage during that stretch, which can signal stronger short term demand and rising market attention.
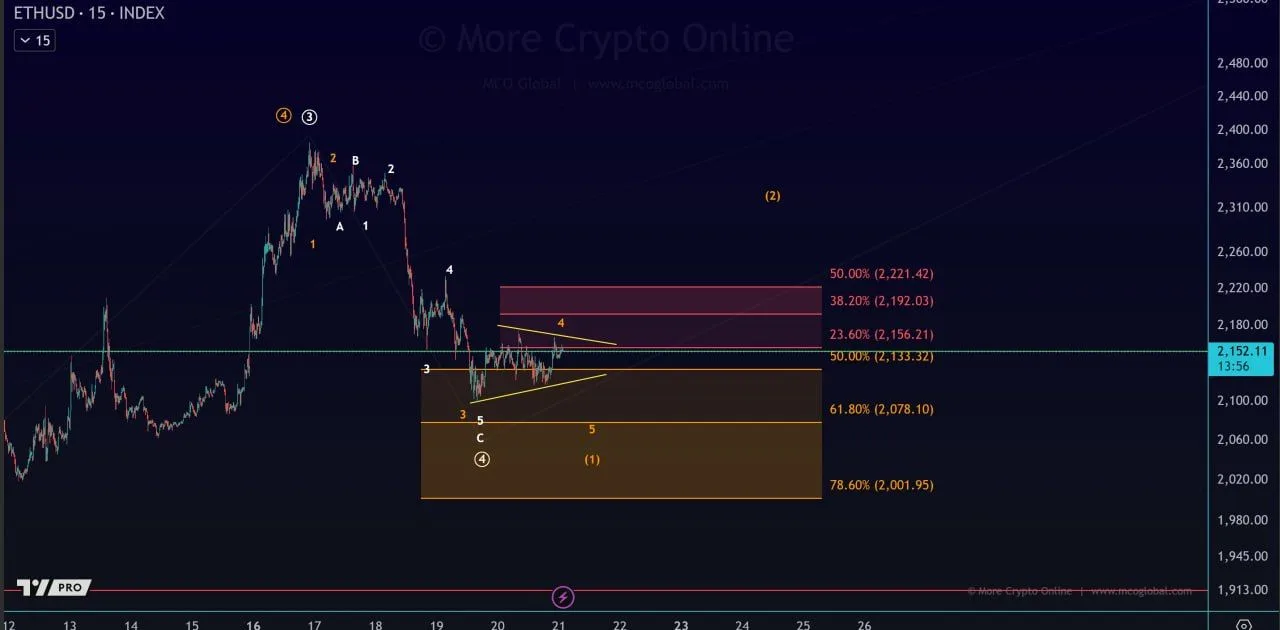
Ethereum triangle keeps $2,221 in focus
Ethereum is moving inside a tight triangle on the 15 minute chart, which shows price compression after a sharp drop. The setup places immediate resistance near $2,221, while support sits around the lower edge of the pattern near the $2,130 area.
Ethereum Triangle Breakout Setup: Source: More Crypto Online
Moreover, the chart shows that a break above $2,221 could open the way toward higher resistance levels near $2,156, $2,192, and then $2,221 again as the upper target zone. However, if Ethereum fails to break out and instead loses triangle support, the chart points to downside levels near $2,078 and $2,001.
For now, the structure shows indecision rather than confirmation. Therefore, $2,221 remains the key trigger level, because a clean move above it would strengthen the case for a short term recovery, while rejection would keep downside risk in place.

 coinpaper.com