
Ethereum is pushing higher after reclaiming a major support area above $2,100, while short term charts show the rally nearing an important resistance zone. Together, the two setups point to a simple question: can $ETH hold above support long enough to extend toward $2,800, or will a pullback start first?
Ethereum Reclaims $2.1K Zone and Opens Path Toward $2.8K
Ethereum has moved back above the key high timeframe area near $2,100 to $2,166. That zone now matters most. The chart shows $ETH bouncing from support near $1,808 and pushing into a range it traded in for much of 2024. As a result, the recent move shifts focus from downside recovery to whether price can hold this reclaimed area.
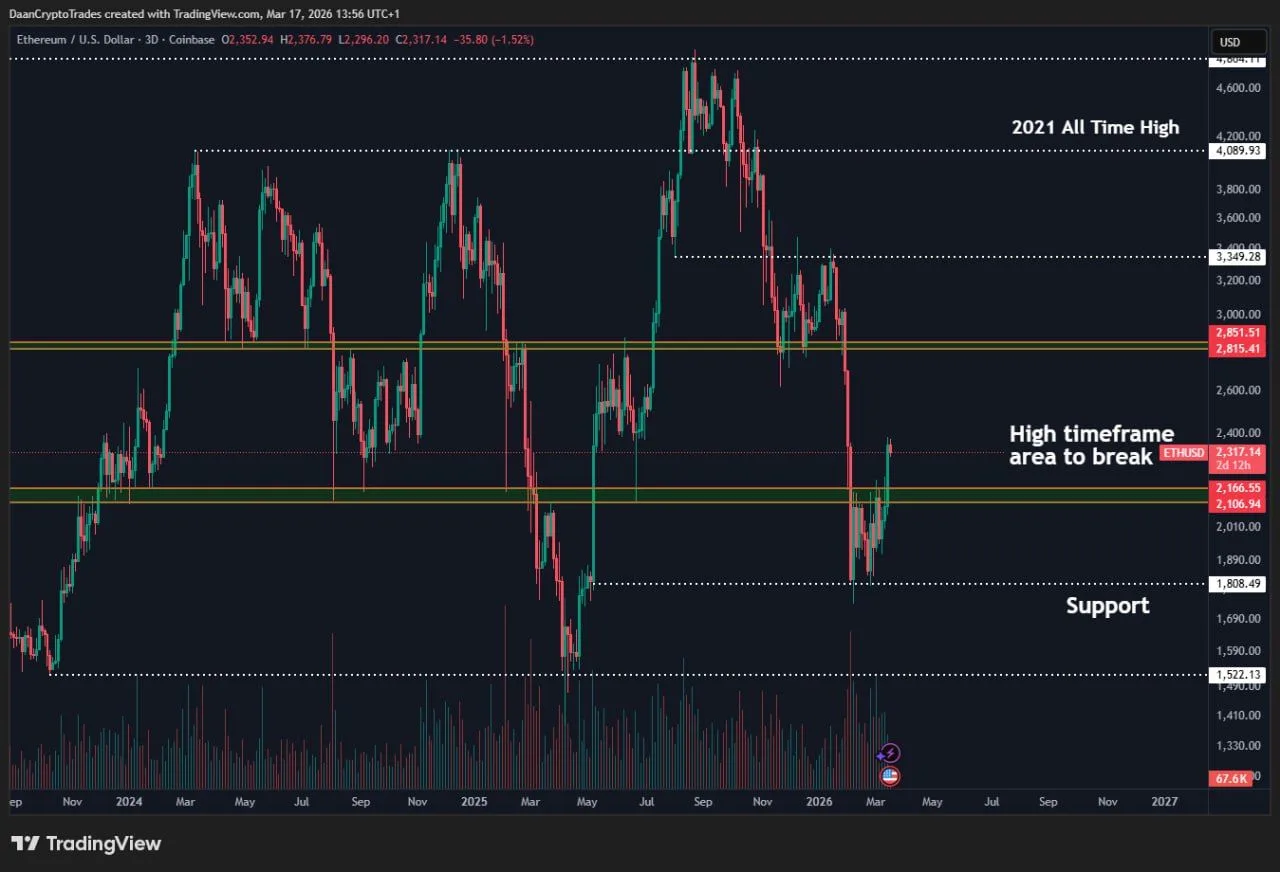
Ethereum Price Chart. Source: DaanCryptoTrades
The structure on the chart is clear. $ETH broke back into the broader $2.1K to $2.8K range after spending time below it. Therefore, this zone now acts as the first important support area. If Ethereum stays above it, the next likely target sits near $2,851, which marked a major range level during 2024. That level also lines up with the upper boundary highlighted on the chart.
At the same time, the chart suggests $ETH is still trading level to level rather than in a clean trend breakout. Daan Crypto Trades also points that out. His view is that as long as $2.1K holds, the path toward $2.8K remains open. However, the move still needs confirmation. A quick rejection back below $2.1K would weaken the recovery and shift attention back to the lower support zones.
The broader context also matters. Ethereum remains well below the 2021 all time high area near $4,089 and below another marked resistance near $3,349. So even though the latest move looks constructive, $ETH is still inside a wider multi year range. In other words, this is a range recovery first, not a full bullish breakout yet.
For now, the main reading is simple. Ethereum has reclaimed a major support zone, and that keeps upside pressure in place. If $2.1K holds, $2.8K becomes the next key level to watch. If that support fails, the market could turn back toward the $1,808 area.
Ethereum Approaches Wave (3) Peak as Pullback Zone Forms Near $2.2K
Ethereum is trading around $2,327 after completing a strong upward move that aligns with a potential wave (3) structure. The chart shows price reaching the 1.38 Fibonacci extension near $2,344, which often acts as a short term resistance level. As a result, momentum appears to slow near this zone.
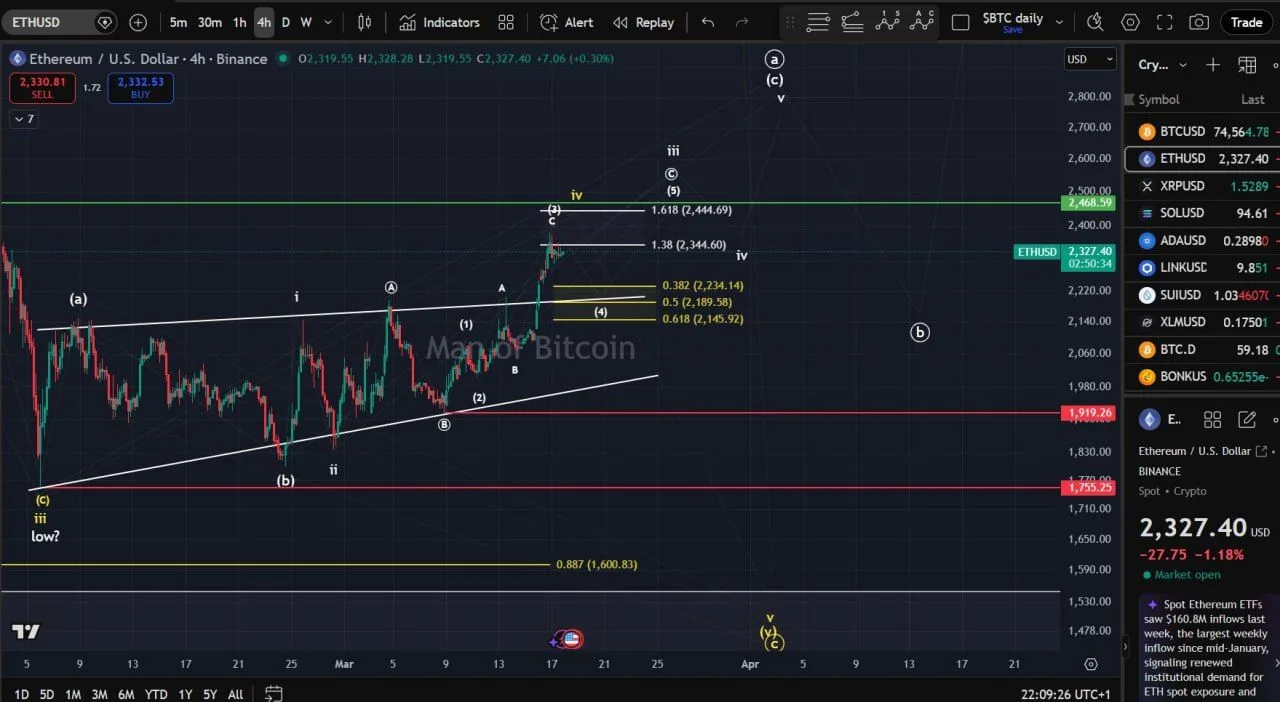
Ethereum Price Chart. Source: Man of Bitcoin
At the same time, the structure suggests that Ethereum may enter a corrective phase. The highlighted Fibonacci retracement levels place the key support zone between $2,234 and $2,145. This area becomes critical. If price pulls back into this range and holds, it would support the idea of a wave (4) correction before another move higher.
The chart also shows a broader upward trend with higher lows forming from the $1,755 and $1,919 levels. That structure keeps the short term trend intact for now. However, price remains below the next resistance near $2,468, which aligns with a higher Fibonacci extension level.
Man of Bitcoin notes that a break below the $2,145 level would weaken the current wave structure. In that case, the pattern would no longer support a continued upward sequence, and downside risk would increase.
For now, Ethereum sits between resistance at the 1.38 extension and support at the $2.2K zone. The next move depends on whether price holds this support range or breaks below it.