
- The Ethereum price is 2.85% short from challenging the key resistance line of ongoing consolidation.
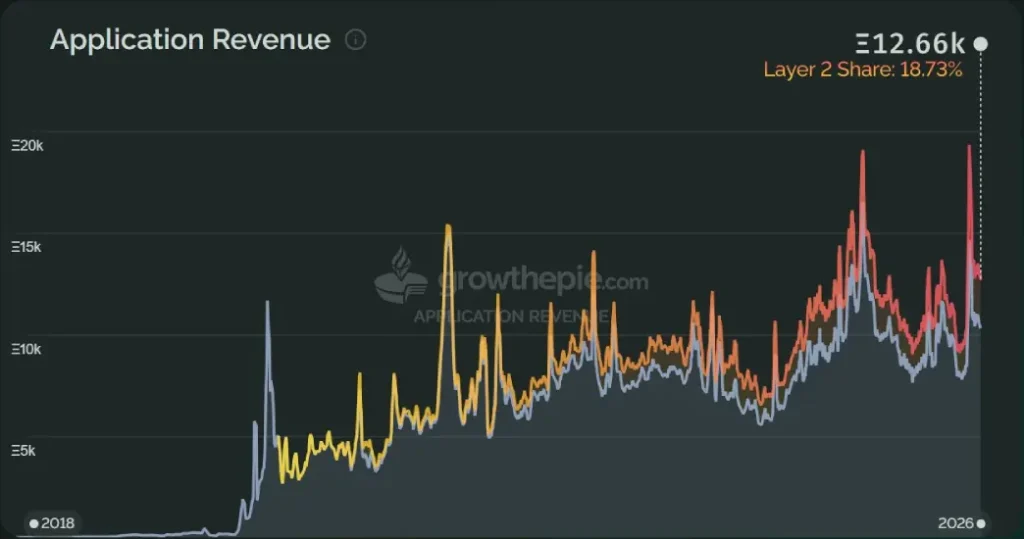
- Application revenue on the Ethereum network has declined to roughly $25.5 million.
- The bollinger band indicator squeezed into a narrow range indicates low volatility trading in $ETH amid ongoing geopolitical tension.
Ethereum, the smart contract giant, is up 1.05% on Wednesday to currently exchange hands at $2,057. The uptick follows the release of annual inflation rate in the U.S. at 2.4%, in line market expectation and bolstering rate cut hopes. However, the short-term trajectory of Ethereum price remains in range bound movement as app revenues are slashed by 57% amid recent correction. Will the loss continue to fuel selling pressure or $ETH has an opportunity to rebound?
Ethereum Price Correction Impacts Application Revenue Metrics
Ethereum price has taken a notable hit in these early months of 2026. The value of one $ETH decreased from around $3,400 to $2,082, registering a loss of 39%.
Analyst Leon Waidmann noted a similar drop in revenue generated by applications built on the Ethereum network. Recent numbers have total application revenue at $25.5 million, which is considerably lower than the peaks of over $60 million recorded in 2025.
Layer-2 networks are now contributing around 18.71% of this overall share of revenue. The shift anchors into lower volumes of transactions on the chain, less speculative trading – and lower activity in decentralized finance protocols.
However, the growthepie analytics platform offers more context on how to interpret these changes in revenue. Dollar-denominated numbers appear significantly lower mainly because of the depreciation of $ETH in price, which affects total value locked in applications, user balances and many pairings or pricing mechanisms associated with $ETH. A decrease in the USD value of $ETH automatically leads to a compression of revenue in terms of dollars.
To take this effect into account, it makes sense to view revenue in $ETH units to get a better view and avoid price swings. A 7-day rolling average applied to the data smooths out any short-term volatility spikes that are often caused by increased DeFi participation during price swings. Over long periods of time application revenue continues to show a positive growth trend even in USD, making it a good measure for determining the health of long-term ecosystems.
Ethereum Price Eyes $2,400 Level With This Breakout
So far this week, the Ethereum price has witnessed a weak-momentum relief rally from $1,929 to $2,086, accounting for a 8% jump. The upswing signals a reach towards the $2,141 resistance which has been limited growth potential for $ETH since February 5th.
The daily chart analysis highlights a short-term consolidation trend between $2,141 and $1,800, indicating lack of initial support from buyers or sellers to drive a sustainable move. Thus, the ongoing recovery must pace up its volume action and breach the overhead resistance with a daily candle closing to accelerate the bullish momentum.
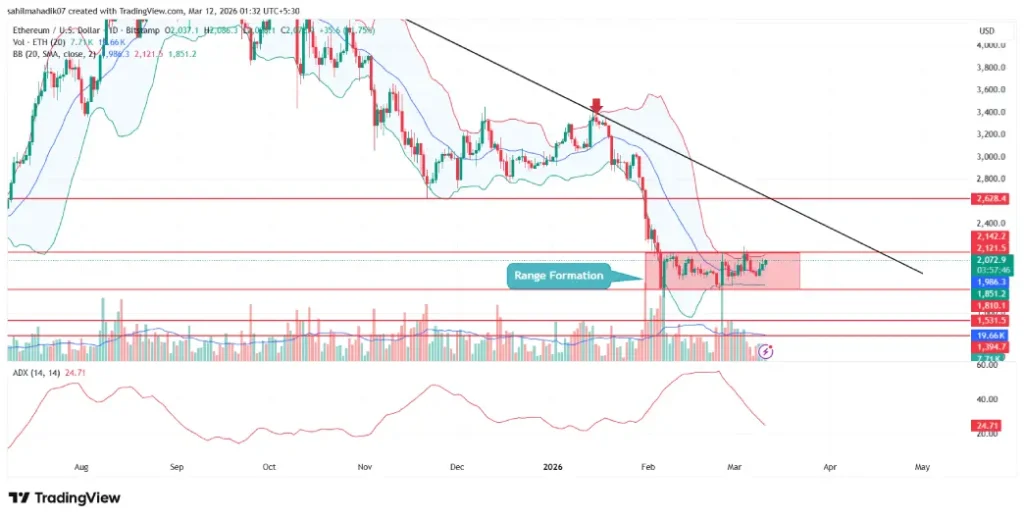
The post-breakout push could lead Ethereum price to $2,400 before its next major resistance of the downsloping trendline. The dynamic resistance drove the mid-term downtrend in $ETH, and carried the sell-the-bounced sentiment in the market.