
TL;DR:
- Ether consolidates in a technical triangle pattern following a severe market correction.
- Analysts identify an “Expanding Diagonal” structure with long-term price targets.
- Support at $1,800 remains firm while the RSI shows early signs of recovery.
The behavior of Ethereum’s price toward $2,000 is capturing market attention as it consolidates in a zone of high technical relevance. Following a significant pullback, the cryptocurrency has formed a compression triangle on the daily chart, suggesting an imminent move.
Currently, the token’s price is struggling to overcome immediate resistance while selling momentum stalls. Investors are acting with caution, as the valuation remains below old support levels, which now appear to be a psychological barrier that is difficult to breach.
Despite short-term uncertainty, higher-timeframe analysis offers a much more optimistic outlook for Ether holders. Expert Gert van Lagen points out that the asset is following a textbook pattern known as an “Expanding Diagonal” that began in 2018.
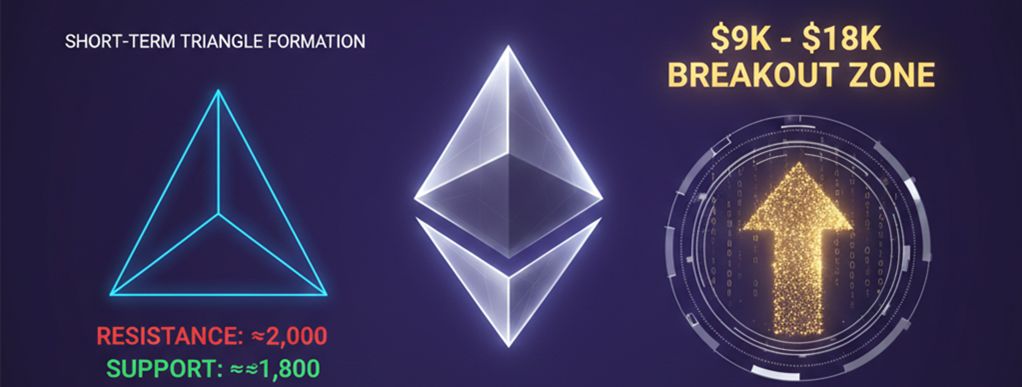
Macro Projections: Toward a Historic Breakout Zone?
This technical structure suggests that once the current consolidation phase is complete, Ethereum could enter its final bullish stage. Projections place the ultimate target for this cycle in a zone between $9,000 and $18,000 per unit.
For this scenario to materialize, it is crucial for Ethereum’s price to establish a solid support base. For now, filling the fair value gaps between $1,800 and $2,300 seems to have provided the necessary liquidity to halt the bleeding.
In summary, although the RSI shows a recovery from oversold levels, the definitive direction will be resolved at the apex of the current triangle. The market awaits clear macroeconomic signals to validate this ambitious technical count and resume the growth path toward new all-time highs.