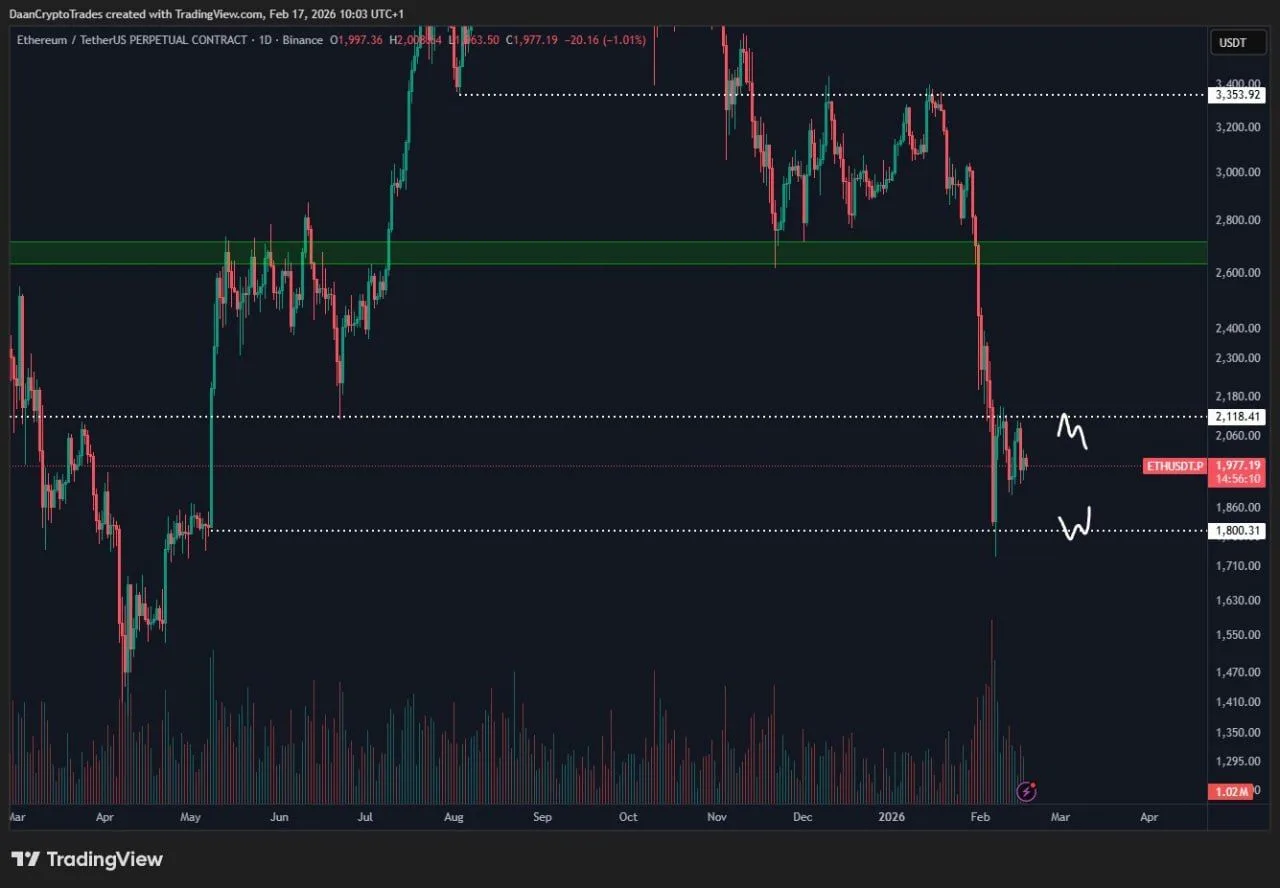
Ethereum/TetherUS Perpetual Chart. Source: Daan Crypto Trades on X
On the chart shared from TradingView, the marked range sits between roughly $1,800 on the downside and $2,118 on the upside, with price moving sideways after a steep drop from the low $3,000s. The latest candle showed $ETH down about 1% on the day, after trading between roughly $1,963 and $2,008.
The same post said the trader set alerts at $1,800 and $2,100 and planned to react only if price reaches either level, framing both zones as near term decision points for the next move.
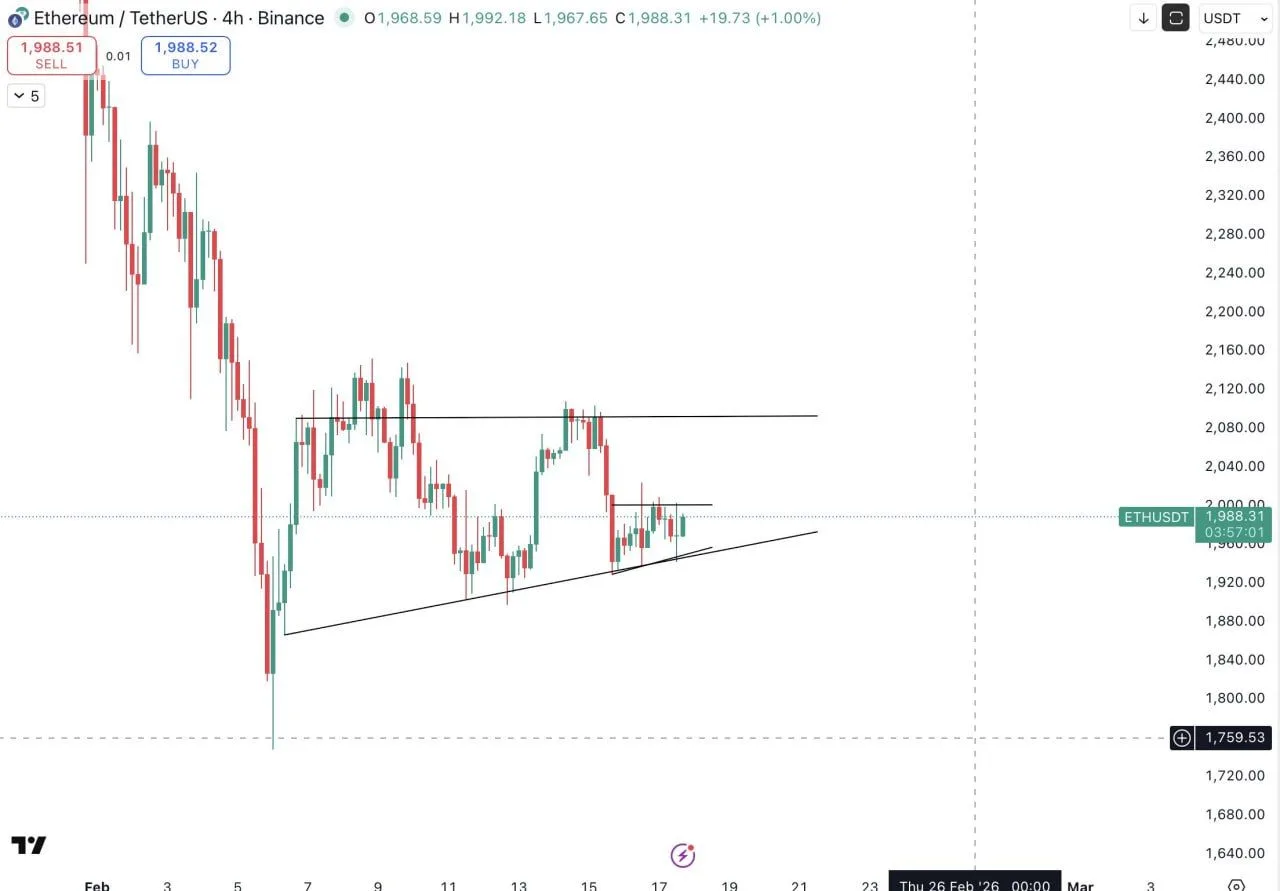
Ethereum forms ascending triangle on 4 hour chart
Ethereum formed a tightening structure on the 4 hour Binance ETHUSDT chart as price compressed between rising support and a flat resistance line, according to technical analysis shared by The Cryptomist on X.
Ethereum/TetherUS 4 Hour Chart. Source: The Cryptomist on X
The chart showed higher lows building along an upward trendline while repeated pullbacks capped near the same horizontal level. This structure outlined an ascending triangle, a pattern that often appears during consolidation phases after a strong directional move.
The Cryptomist said the setup pointed to a potential upside resolution if price breaks and holds above the marked resistance. The analyst flagged a first target near $2,090, while the broader breakout projection from the pattern sat near $2,350, based on the measured move of the triangle range.
The same chart also showed a recent rebound from the rising support line, followed by tighter candles near the pattern’s upper boundary. As a result, the market remained compressed inside the structure, with short term direction depending on whether price clears resistance or returns to test trend support again.

 coinpaper.com