
$ETH price prediction faces mixed signals as Ethereum trades near $2,050 while staking reaches a record share of total supply. At the same time, $ETH/$BTC remains capped by a long-term downtrend, which keeps relative momentum weak.
Staked $ETH climbs past 30% while price stays near recent lows
Ethereum's staking rate rose to a new high above 30.5% of total $ETH supply, even as ether traded around $2,050, according to a CryptoQuant chart shared by analyst Leon Waidmann on X. The chart labeled “Ethereum: $ETH 2.0 Staking Rate (%)” shows the staking share climbing in a steady uptrend since early 2023, while the price line moved through multiple rallies and selloffs over the same period.
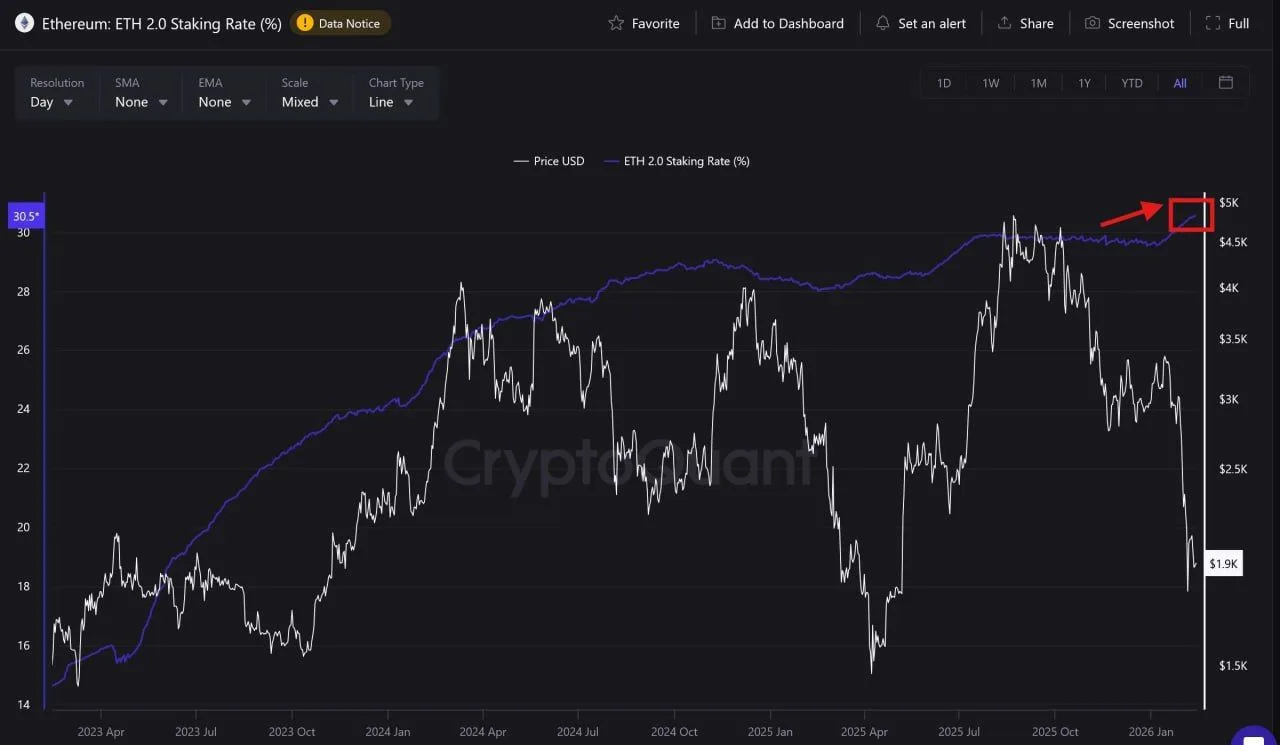
$ETH 2.0 Staking Rate (%). Source: CryptoQuant / X
The CryptoQuant data suggests the staking rate roughly doubled from about 15% in early 2023 to more than 30% by early 2026. Meanwhile, the price axis on the same chart shows ether near $1.9K at the latest point, well below prior peaks marked above $4,000 and near $4,500 during 2024 and 2025.
Waidmann described the move as a divergence, arguing that staking continued to rise regardless of market direction. He also pointed to earlier periods when staking increased while price stayed flat or fell, and he said ether later climbed in subsequent months. Those references reflect his interpretation of past market behavior rather than a guaranteed outcome.
Staking locks $ETH into validator operations to help secure the network, and it can reduce the amount of ether immediately available to trade. At the same time, liquidity conditions also depend on where $ETH sits across exchanges, custodians, and staking providers, as well as how easily holders can exit positions.
$ETH/$BTC stays pinned under long-term downtrend as ratio hovers near multi-year lows
The $ETH/$BTC trading pair remained below a descending trendline that has capped rallies for nearly eight years, according to a biweekly chart from Binance shared by X user TedPillows. The chart labeled “Ethereum / Bitcoin – 2W (Binance)” shows a long series of lower highs from 2017 through early 2026, with each rebound failing near the same falling resistance line.
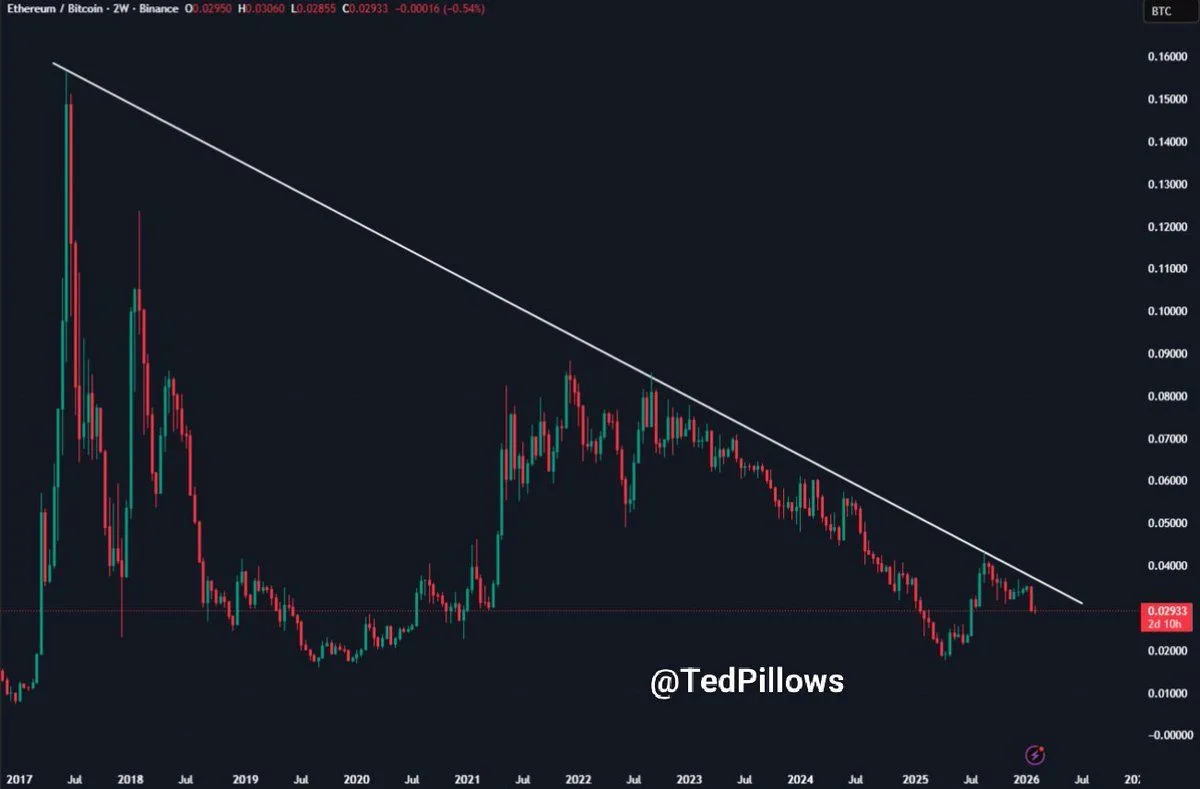
Ethereum / Bitcoin – 2W (Binance). Source: TradingView / X
At the latest reading, the ratio traded near 0.0293 $BTC per $ETH, based on the chart’s right-side price marker. Over recent years, the pair posted repeated lower peaks during recovery attempts in 2018, 2021, and 2022. However, each move stalled under the same descending trendline, which continues to define the broader structure. As a result, the market has not confirmed a sustained shift in relative strength toward ether versus bitcoin.
Price action since 2024 shows another bounce from the lower end of the range, followed by renewed pressure as the pair approached the long-term resistance. Therefore, the structure still reflects a broader downtrend on higher time frames. In turn, this signals that ether has continued to lag bitcoin in relative performance across multiple cycles.
TedPillows said a decisive break above the trendline could mark a regime change for $ETH/$BTC and reshape relative momentum between the two assets. That view reflects the analyst’s interpretation of technical structure rather than a confirmed outcome. For now, the chart shows resistance holding, while the pair trades below the multi-year ceiling that has defined relative performance since 2017.