
Ethereum’s $ETH $BTC ratio has started rebounding after a multi year slide, while spot $ETH still trades below broken support. Together, the charts point to rotation back into Ethereum, but with downside risk toward $1,900–$1,700 still on the table.
$ETH $BTC Ratio Rebounds After Multi Year Decline
Ethereum’s price relative to Bitcoin has begun to recover after a prolonged multi year decline, according to weekly chart data from Binance. The $ETH $BTC pair formed a broad base after trending lower since 2022, with price recently rebounding from a long held demand zone that previously marked cycle lows. The move followed a final downside sweep that cleared remaining sell pressure and short side liquidity before reversing higher.
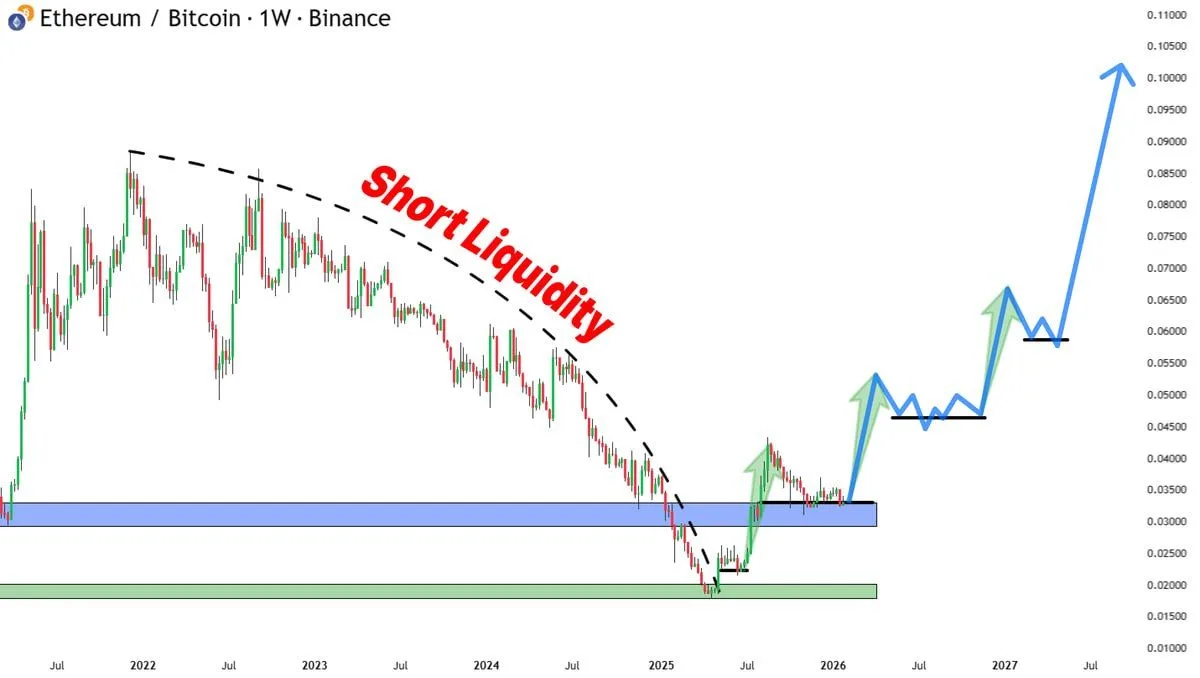
Ethereum/Bitcoin 1-Week Chart. Source: Binance/X
The recovery shows a shift in market structure. After years of lower highs and persistent weakness, $ETH $BTC has started printing higher lows, suggesting downside momentum has slowed. Capital rotation appears to be improving as the ratio holds above its base and attempts to build acceptance at higher levels. This behavior contrasts with earlier rebounds that failed quickly and rolled back into the downtrend.
If the current structure holds, the chart points to a continuation scenario rather than a short term bounce. The absence of strong selling on recent pullbacks suggests long term distribution has eased. As a result, $ETH $BTC may continue stair stepping higher toward prior resistance zones, with further upside possible if capital flows into Ethereum remain stable against Bitcoin.
Trader Flags $1,900–$1,700 as Long-Term $ETH Buy Zone
An unknown trader shared a long-term Ethereum outlook on X, pointing to a potential buying zone between $1,900 and $1,700. The view comes as $ETH continues to trade below prior support, with price recently hovering near the $2,700 area on the TradingView chart dated Jan. 30.
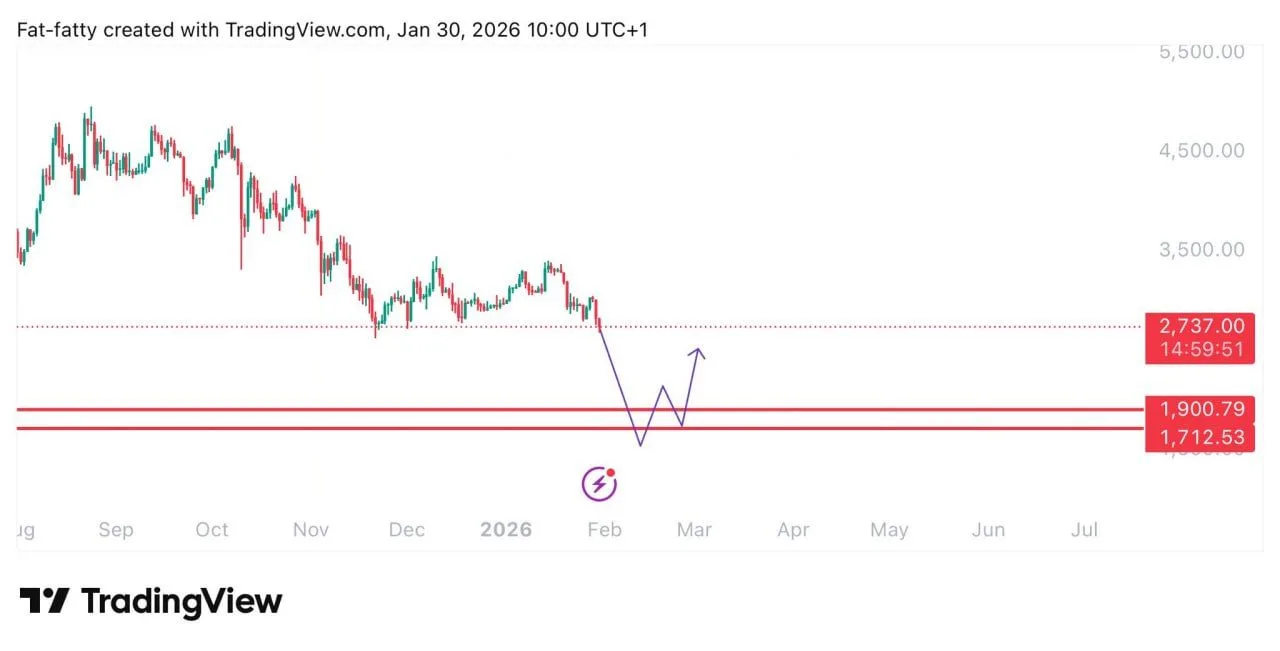
Ethereum Price Chart. Source: TradingView/X
The chart shows Ethereum in a broader downtrend from late 2025 highs, followed by a breakdown into early 2026. The trader’s projection marks a deeper pullback toward the $1,900–$1,700 range, where previous demand and historical price reactions are visible.
According to the post, the highlighted zone could act as a long-term accumulation area if price revisits it, before any potential recovery attempt later in the cycle. The scenario suggests short-term weakness first, followed by a rebound once lower support levels are tested.