
Markets are attempting a cautious rebound, with the Ethereum price hovering near its daily pivot as traders reassess risk after the latest pullback.
Summary
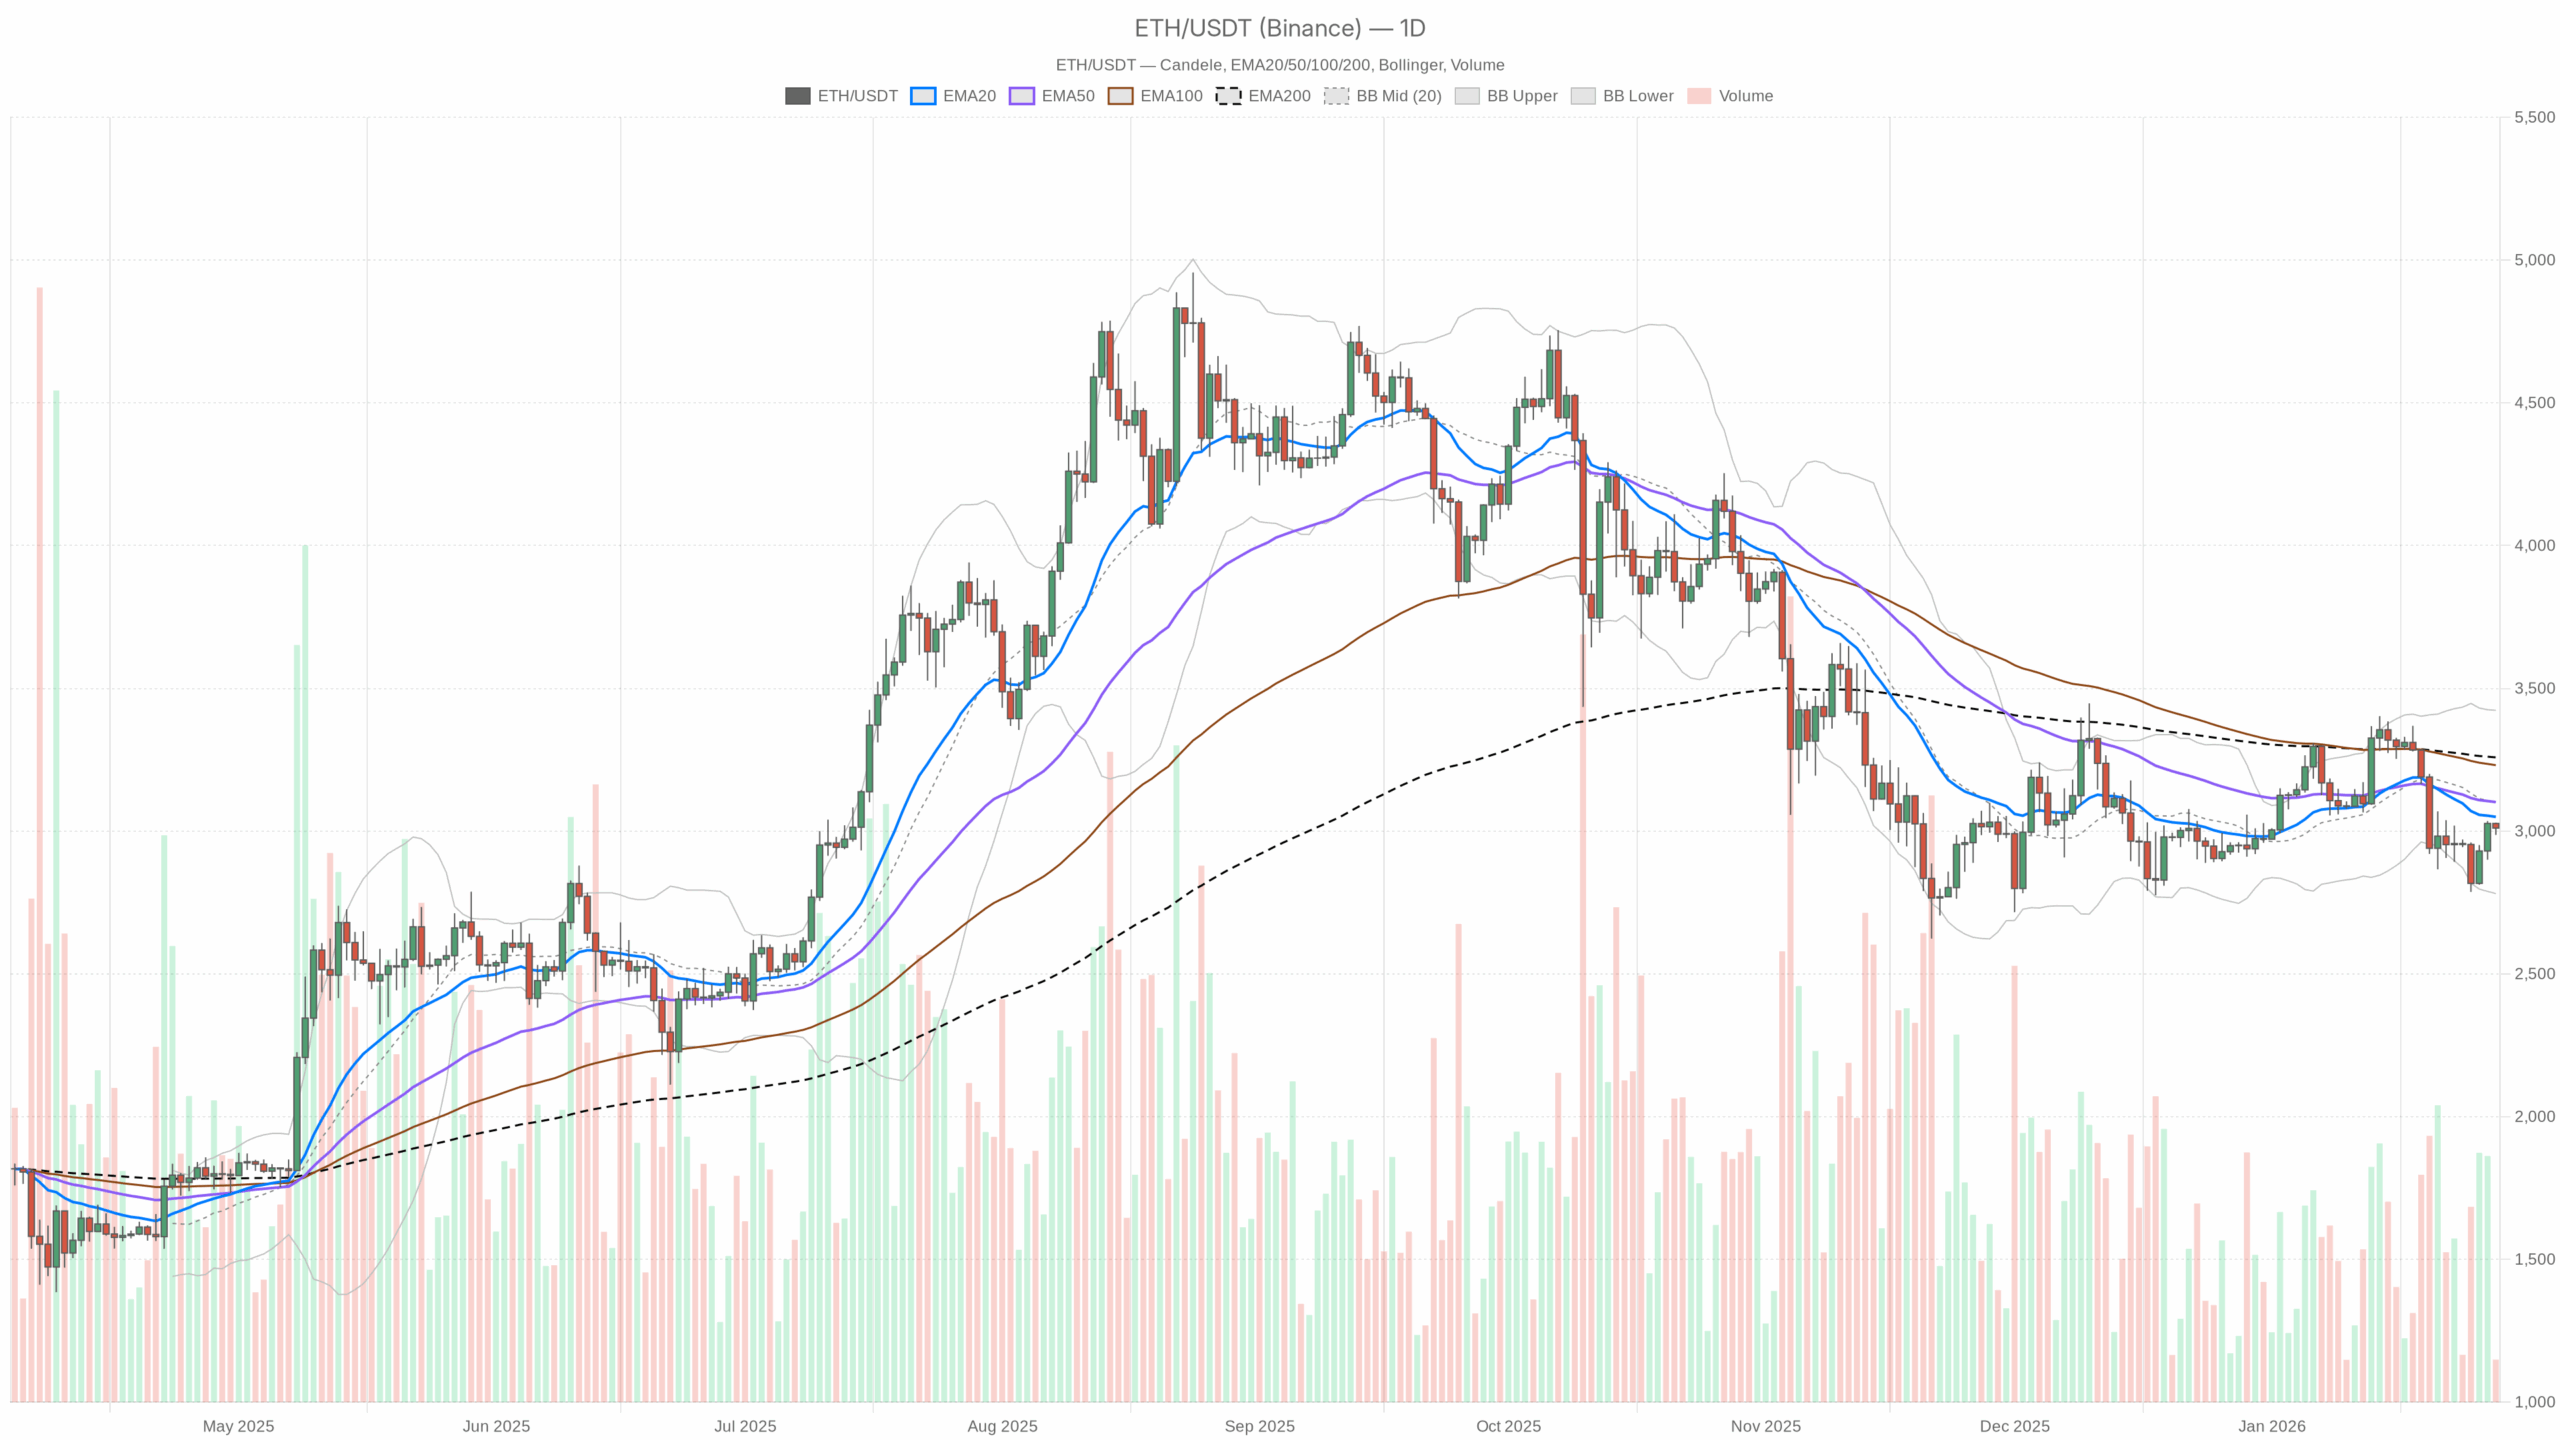
Daily Chart (D1) – Macro Bias: Bearish, But Not Oversold
Daily regime: bearish. Price is below the 20, 50, and 200-day EMAs, and momentum has cooled without flushing into panic. That combination points to a controlled downtrend or extended correction, not a capitulation event.
Trend & Structure (D1)
– Price: $3,010.64
– EMA20: $3,049.91
– EMA50: $3,101.63
– EMA200: $3,258.23
Ethereum is trading below all three key EMAs. The short-term trend (20-day), medium-term (50-day), and long-term (200-day) are all overhead and stacked bearishly. In practice, that means every bounce into the $3,050–3,260 range is still technically a rally into resistance, not yet the start of a new leg higher. Bulls are fighting the tape, not surfing it.
RSI (D1)
– RSI 14: 46.81
RSI is slightly below the midline and gently pointing down. Ethereum is in a mild bearish momentum pocket but far from oversold. There is room for further downside without hitting exhaustion, which keeps the door open for another leg lower if sellers reassert control.
MACD (D1)
– MACD line: -42.54
– Signal line: -20.88
– Histogram: -21.66
MACD is negative with the line below the signal and the histogram also negative. That is confirmed downside momentum, not just a sideways pause. The trend of the indicator tells you bears have had the upper hand for several sessions, which matches the price sitting under all major EMAs.
Bollinger Bands (D1)
– Middle band: $3,102.16
– Upper band: $3,423.09
– Lower band: $2,781.24
Price is just under the middle band, roughly in the lower half of the band range. Ethereum is not hugging the lower band, so this is not a full-on trend breakdown; it is more a controlled drift lower within a wide volatility envelope. Mean reversion toward $3,100–3,150 is possible, but the broader band structure still favors a sell-the-rip environment unless price can base above the mid-band.
ATR & Volatility (D1)
– ATR 14: $121.40
Daily ATR around $120 says typical one-day swings of 3–4%. That is elevated but not extreme for $ETH. In practical terms, a move from $3,010 down to around $2,890 or up to about $3,130 can happen in a normal session. Position sizing needs to respect that range; tight stops near the noise will get harvested.
Daily Pivot Levels (D1)
– Pivot point (PP): $3,009.01
– R1: $3,031.42
– S1: $2,988.22
Price is pinned right at the pivot. The immediate intraday battlefield is $2,990–3,030. Sustained trade below S1 would confirm sellers are still in control of the daily tape, while building a base above R1 would be the first sign that buyers are slowly absorbing supply.
D1 takeaway: The main scenario is bearish. Ethereum is in a controlled downtrend, not washed out, with rallies into the $3,050–3,250 area still favorable for profit-taking or short positioning for active traders.
1-Hour Chart (H1) – Short-Term Buyers Pushing Against Resistance
The hourly chart shifts the picture. Here, Ethereum has staged a modest recovery off the lows and is trying to reclaim key intraday levels, but the regime is printed as neutral, reflecting this tug-of-war between the daily downtrend and an intraday rebound.
Trend & EMAs (H1)
– Price: $3,010.02
– EMA20: $2,991.34
– EMA50: $2,961.68
– EMA200: $2,995.68
On the 1-hour chart, price is trading above all three EMAs. The fast EMAs (20 and 50) have curled up and are now below price, with the 200-hour reclaimed as well. That is a classic short-term recovery structure: the market is pricing a bounce, but it is still nested inside a bearish daily context. The intraday trend is up, while the higher time frame trend is down. That is the core time-frame tension right now.
RSI (H1)
– RSI 14: 58.52
RSI is leaning bullish but not overbought. That reflects a healthy recovery rather than frothy momentum. Buyers have the intraday initiative, but there is plenty of room before any overextension, which supports the idea that price could see a further push toward local resistances if broader market conditions cooperate.
MACD (H1)
– MACD line: 18.27
– Signal line: 21.34
– Histogram: -3.07
MACD is slightly positive but with the line just under the signal, giving a mixed, slightly weakening read. Momentum was bullish, has cooled, and is now pausing. This lines up with price stalling around the hourly pivot and resistance levels. Bulls control the short-term trend, but they are losing some steam right at an important decision zone.
Bollinger Bands (H1)
– Middle band: $2,995.11
– Upper band: $3,057.00
– Lower band: $2,933.21
Price is trading slightly above the middle band, inside the upper half of the envelope. That is consistent with a moderate, non-parabolic advance. There is room toward the upper band near $3,050–3,060 before intraday conditions look stretched. That band region aligns neatly with higher time frame resistance from the daily EMAs, making it a logical near-term ceiling.
ATR & Volatility (H1)
– ATR 14: $20.04
Typical hourly candles swinging around $20 imply 0.6–0.7% intraday noise. Ethereum can easily travel between the H1 support and resistance pivots within a few candles. Short-term traders should assume mean-reversion behavior inside this band unless a strong catalyst kicks in.
Hourly Pivot Levels (H1)
– Pivot point (PP): $3,004.10
– R1: $3,021.62
– S1: $2,992.51
Price is hovering just above the hourly pivot. Holding above $3,000 and building acceptance above $3,022 would keep the short-term bullish drift intact. A push back below $2,993 would show the bounce is fading and sellers are reasserting in line with the daily bias.
15-Minute Chart (M15) – Execution Zone: Local Uptrend With Tight Ranges
The 15-minute chart is where execution decisions get refined. Here, Ethereum is in a bullish intraday regime, grinding higher but within a relatively tight range.
Trend & EMAs (M15)
– Price: $3,010.02
– EMA20: $3,002.45
– EMA50: $2,998.95
– EMA200: $2,959.09
On this short timeframe, price is well above the EMA20 and EMA50, and significantly above the EMA200. That is a clear local uptrend with stacked, rising moving averages. On its own, the M15 chart supports continuation higher. However, it is moving right into the teeth of daily resistance.
RSI (M15)
– RSI 14: 56.94
RSI sits comfortably in bullish territory, not overheated. This is typical of a controlled grind up where breakout attempts can still find follow-through, provided higher time frames do not reject price sharply.
MACD (M15)
– MACD line: -1.08
– Signal line: -1.53
– Histogram: 0.45
MACD on M15 is just crossing upward from slightly negative territory. That fits a picture of a fresh micro-bounce after a tiny consolidation. Momentum is picking up, but the move is still very early and fragile.
Bollinger Bands (M15)
– Middle band: $3,002.84
– Upper band: $3,017.23
– Lower band: $2,988.44
Price is near the upper band with bands relatively tight. That reflects a short-term breakout attempt from a low-volatility range. If price can ride the upper band toward $3,015–3,020 without abrupt rejection, the local up-move can extend. A quick snap back inside the band middle would flag a failed breakout.
ATR & Volatility (M15)
– ATR 14: $8.75
On 15-minute candles, typical moves around $8–9 mean micro swings of about 0.3%. That is relatively tight for $ETH and reinforces that this is a compressed, choppy execution environment intraday. Small stops and scalps can work here, but they are vulnerable to sudden spikes as liquidity thins.
15-Minute Pivot Levels (M15)
– Pivot point (PP): $3,011.37
– R1: $3,014.35
– S1: $3,007.03
Price is sitting just under the M15 pivot. Short-term scalpers will watch the $3,007–3,014 band closely: hold above and it acts as a springboard toward the H1 R1 area; lose it, and Ethereum likely slides back toward $3,000 and below into the hourly S1.
Market Context: Risk Still Cautious, $ETH Under Pressure
Beyond the chart, broader crypto market cap is up about 1.9% in 24 hours, but $BTC dominance is high at around 57% and the Fear & Greed Index sits at 29 (Fear). That combination says flows are conservative, favoring Bitcoin and stablecoins over high-beta alt exposure.
Ethereum’s share of total market cap, around 11.7%, shows it remains a core asset, but this is not an environment where the market is eager to chase $ETH aggressively higher. DeFi fee activity on Uniswap, Curve, and other protocols has rebounded strongly over 30 days but is mixed on the 7-day view, which lines up with this corrective tone: on-chain activity is recovering from lows, but traders are far from euphoric.
Bullish Scenario for Ethereum Price
The bull case is a counter-trend rally that gradually turns into a base above $3,000.
In the bullish path, $ETH holds above the daily pivot at $3,009 and the hourly S1 around $2,993, using dips toward $3,000 as liquidity grabs rather than breakdowns. Intraday, the M15 and H1 uptrends stay intact, with price building higher lows above the EMA20 on both time frames.
The first step for bulls: a clean push and sustained hold above $3,030–3,050, where the H1 R1 and daily EMA20 cluster. If that area is reclaimed and starts acting as support, the market can then target the $3,100–3,150 band (daily mid-Bollinger band and EMA50). That zone is the real battleground. A successful break and consolidation above EMA50 would be the first credible sign that the broader correction is ending and that the trend is shifting back toward neutral or even bullish on D1.
In a more optimistic extension, a squeeze toward the daily upper Bollinger near $3,400 is possible if overall crypto sentiment improves and $BTC continues to grind higher. However, that would likely require a macro shift in risk appetite, not just local technicals.
What invalidates the bullish scenario?
A decisive daily close below $2,950–2,960 would seriously damage the bull case. That would mean losing the current support shelf, pushing RSI deeper below 50 and likely expanding MACD downside. Technically, that would confirm the rally attempts were just distribution inside a larger down-leg.
Bearish Scenario for Ethereum Price
The bear case is more aligned with the current daily regime: the bounce fades and $ETH resumes its drift lower within the wider volatility bands.
In the bearish path, Ethereum fails to sustain trade above $3,030–3,050. Attempts to break this zone get rejected, with lower time frames rolling over: M15 loses its EMA20 and EMA50 and starts printing lower highs, while H1 MACD turns decisively down and RSI retreats toward 40.
A move back below $3,000, especially if it comes with rising volume and expansion in hourly ATR, would signal that sellers are back in charge. From there, bears can push toward the $2,950–2,900 region first, and if fear increases and the overall market softens, a deeper test toward the lower daily Bollinger band in the $2,800–2,820 zone becomes plausible.
Given RSI on D1 is not oversold, bears have room to pressure price lower without hitting a strong momentum floor. That favors a grind down scenario rather than a sudden reversal, especially if $BTC dominance stays high and alt sentiment remains weak.
What invalidates the bearish scenario?
A clear daily close back above the daily EMA50 (around $3,100), followed by follow-through toward the EMA200 around $3,260, would put real stress on the bearish narrative. If that move happens with daily RSI reclaiming and holding above 55 and MACD flattening toward zero, the downtrend argument loses credibility. At that point, traders are looking at a transition back into a broader range or a new uptrend.
How to Think About Positioning Right Now
From a trading standpoint, Ethereum is caught between short-term bullish momentum and a medium-term bearish structure. That kind of time-frame conflict is where traders often overtrade, chasing intraday signals while ignoring the bigger picture.
For directional exposure, the key is to respect the daily bias: until $ETH reclaims at least the 20- and 50-day EMAs with conviction, rallies are more likely to be mean-reversion opportunities within a downtrend rather than the start of a sustained bull leg. Intraday longs can still make sense, but they are fighting the higher time frame and should be treated as tactical, not strategic.
Volatility, while not extreme, is still significant: a normal day can easily swing 3–4%. Leverage and position size need to be scaled accordingly to avoid getting forced out by routine noise. Uncertainty remains elevated, with broader market sentiment in fear and $BTC dominating flows, so scenario planning matters more than prediction.
In short, the Ethereum price is attempting a bounce inside a corrective structure. As long as $3,050–3,150 caps the upside on daily closes, the burden of proof stays on the bulls.
This section contains a sponsored affiliate link. We may earn a commission at no additional cost to you.
Disclaimer: This analysis is for informational and educational purposes only and does not constitute investment, trading, or financial advice. Markets are volatile and unpredictable; always do your own research and assess your own risk tolerance before making any trading decisions.