
Ethereum price is down about 1.3% over the past 24 hours and nearly 10% over the past week. This is no longer just short-term volatility. On the daily chart, the $ETH price has already broken below a key neckline, activating a bearish structure that warns of a potential 20% downside if support fails.
At the same time, a new variable has entered the picture. Capital appears to be rotating from Bitcoin into Ethereum, helping spark a short-term rebound. Whether that rotation can turn this breakdown into a bear trap now depends on who is actually buying, who is selling into strength, and which price levels hold next.
Ethereum Breakdown Activates, But $BTC-to-$ETH Rotation Sparks a Rebound
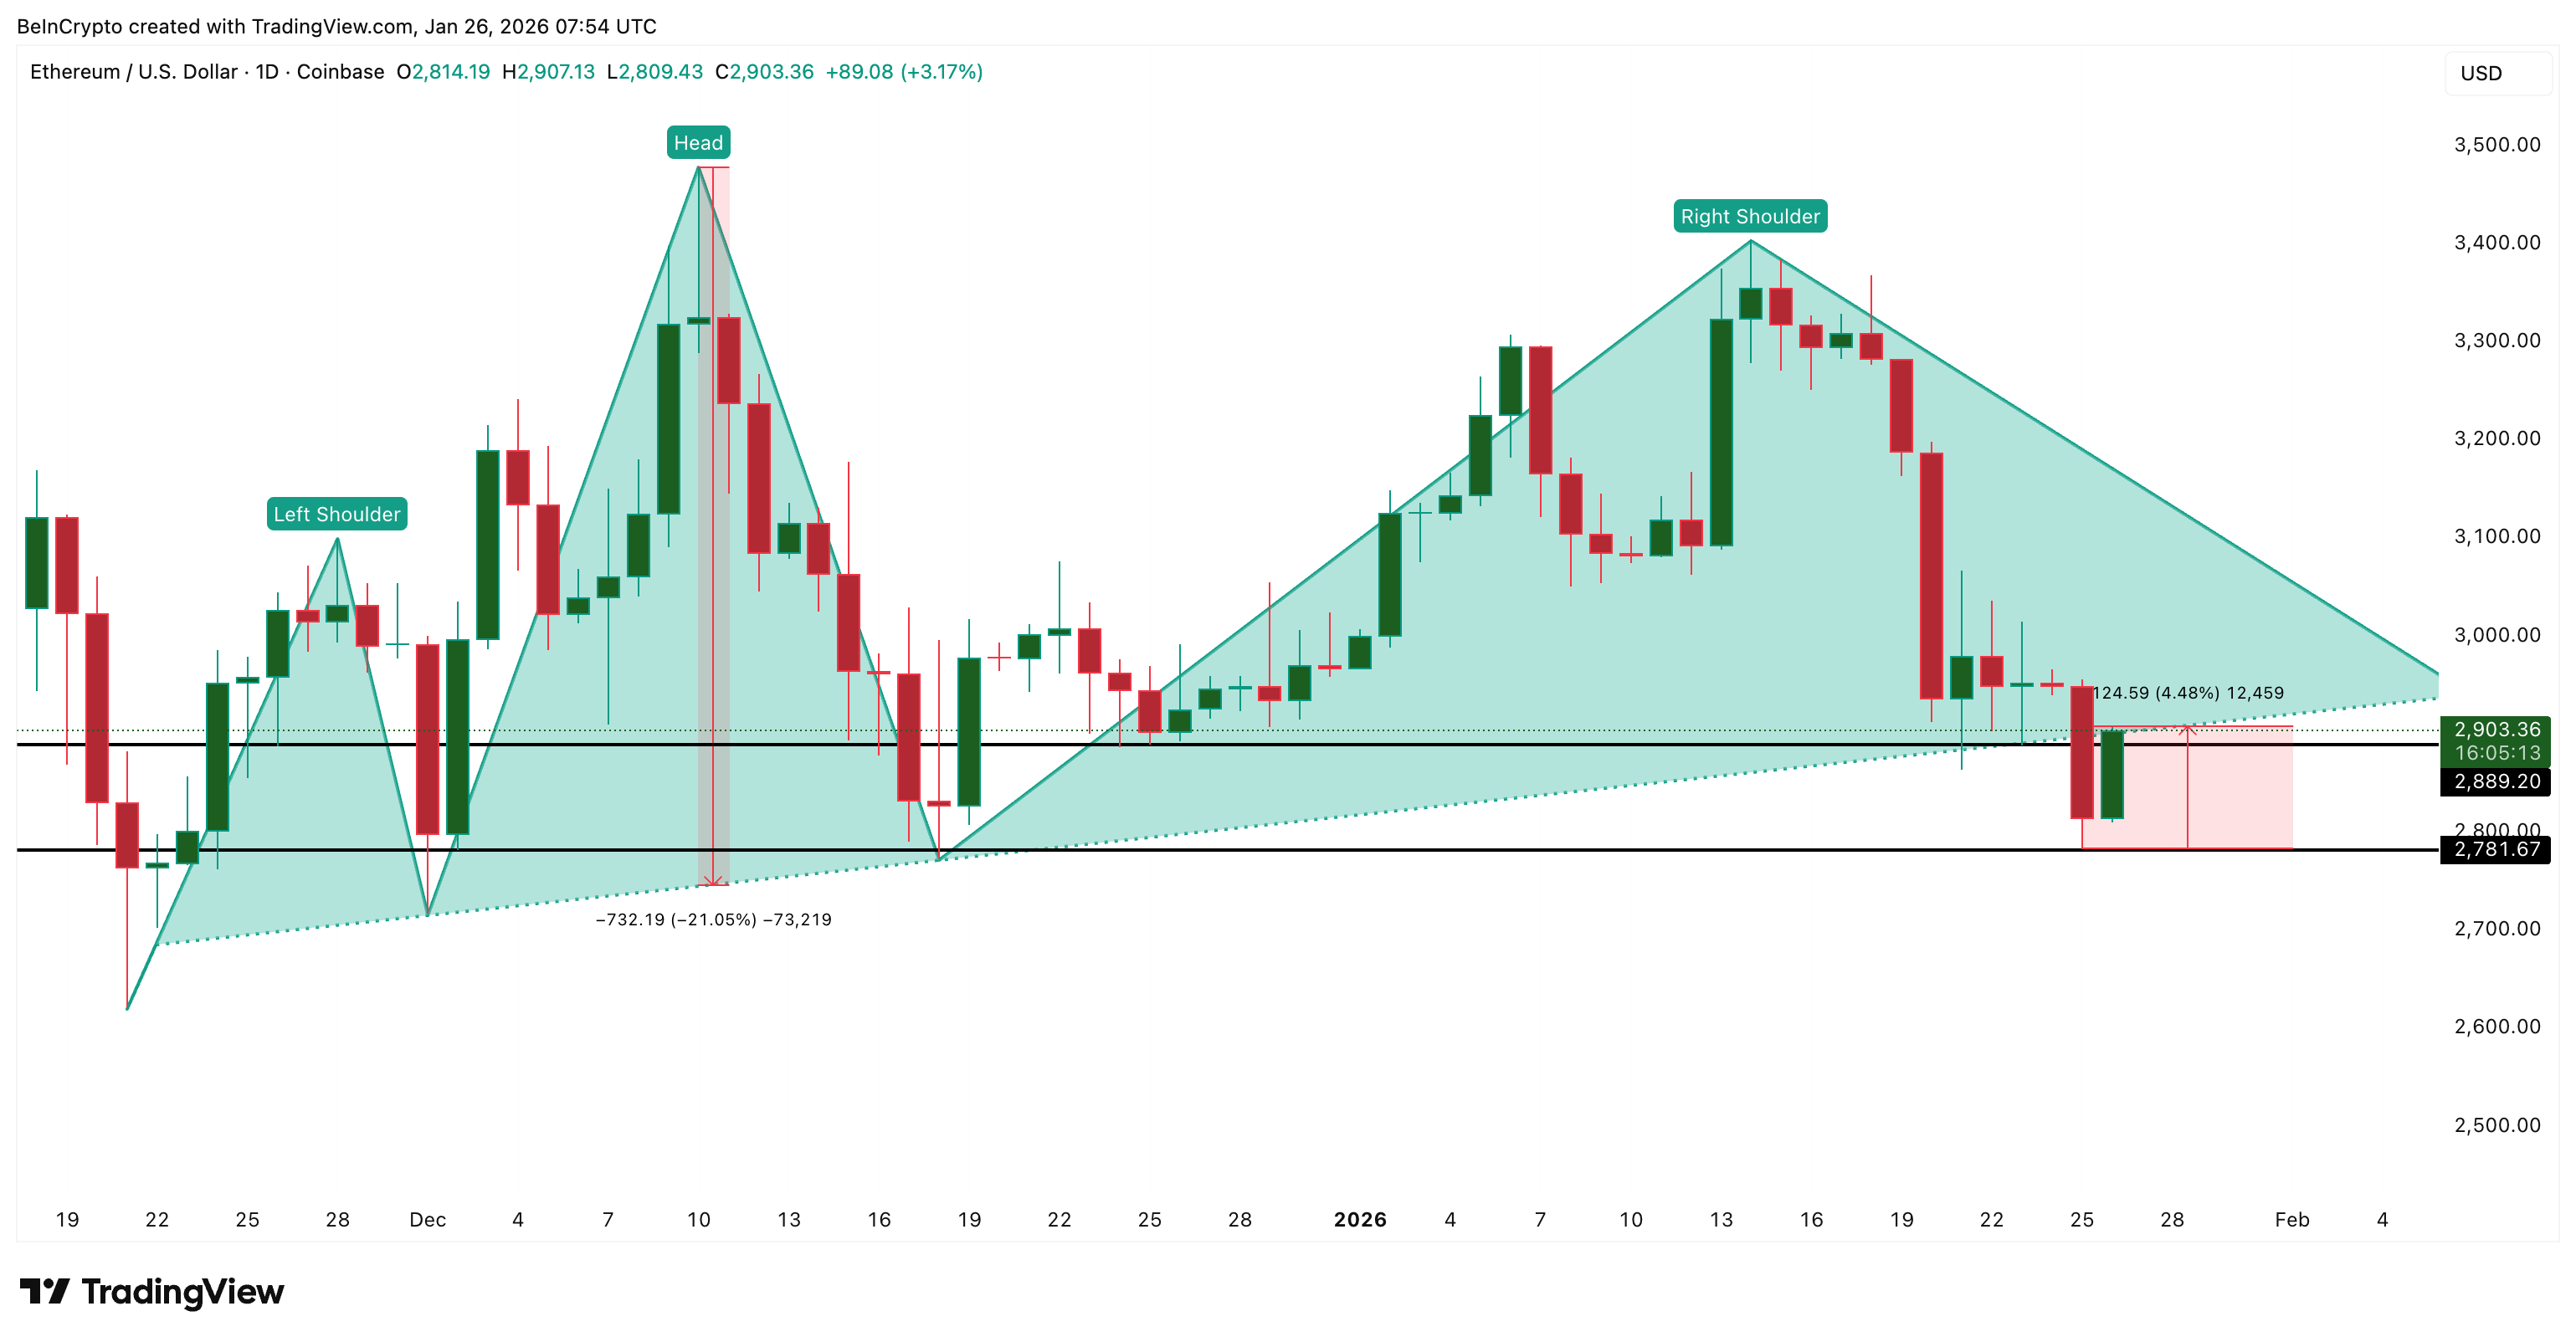
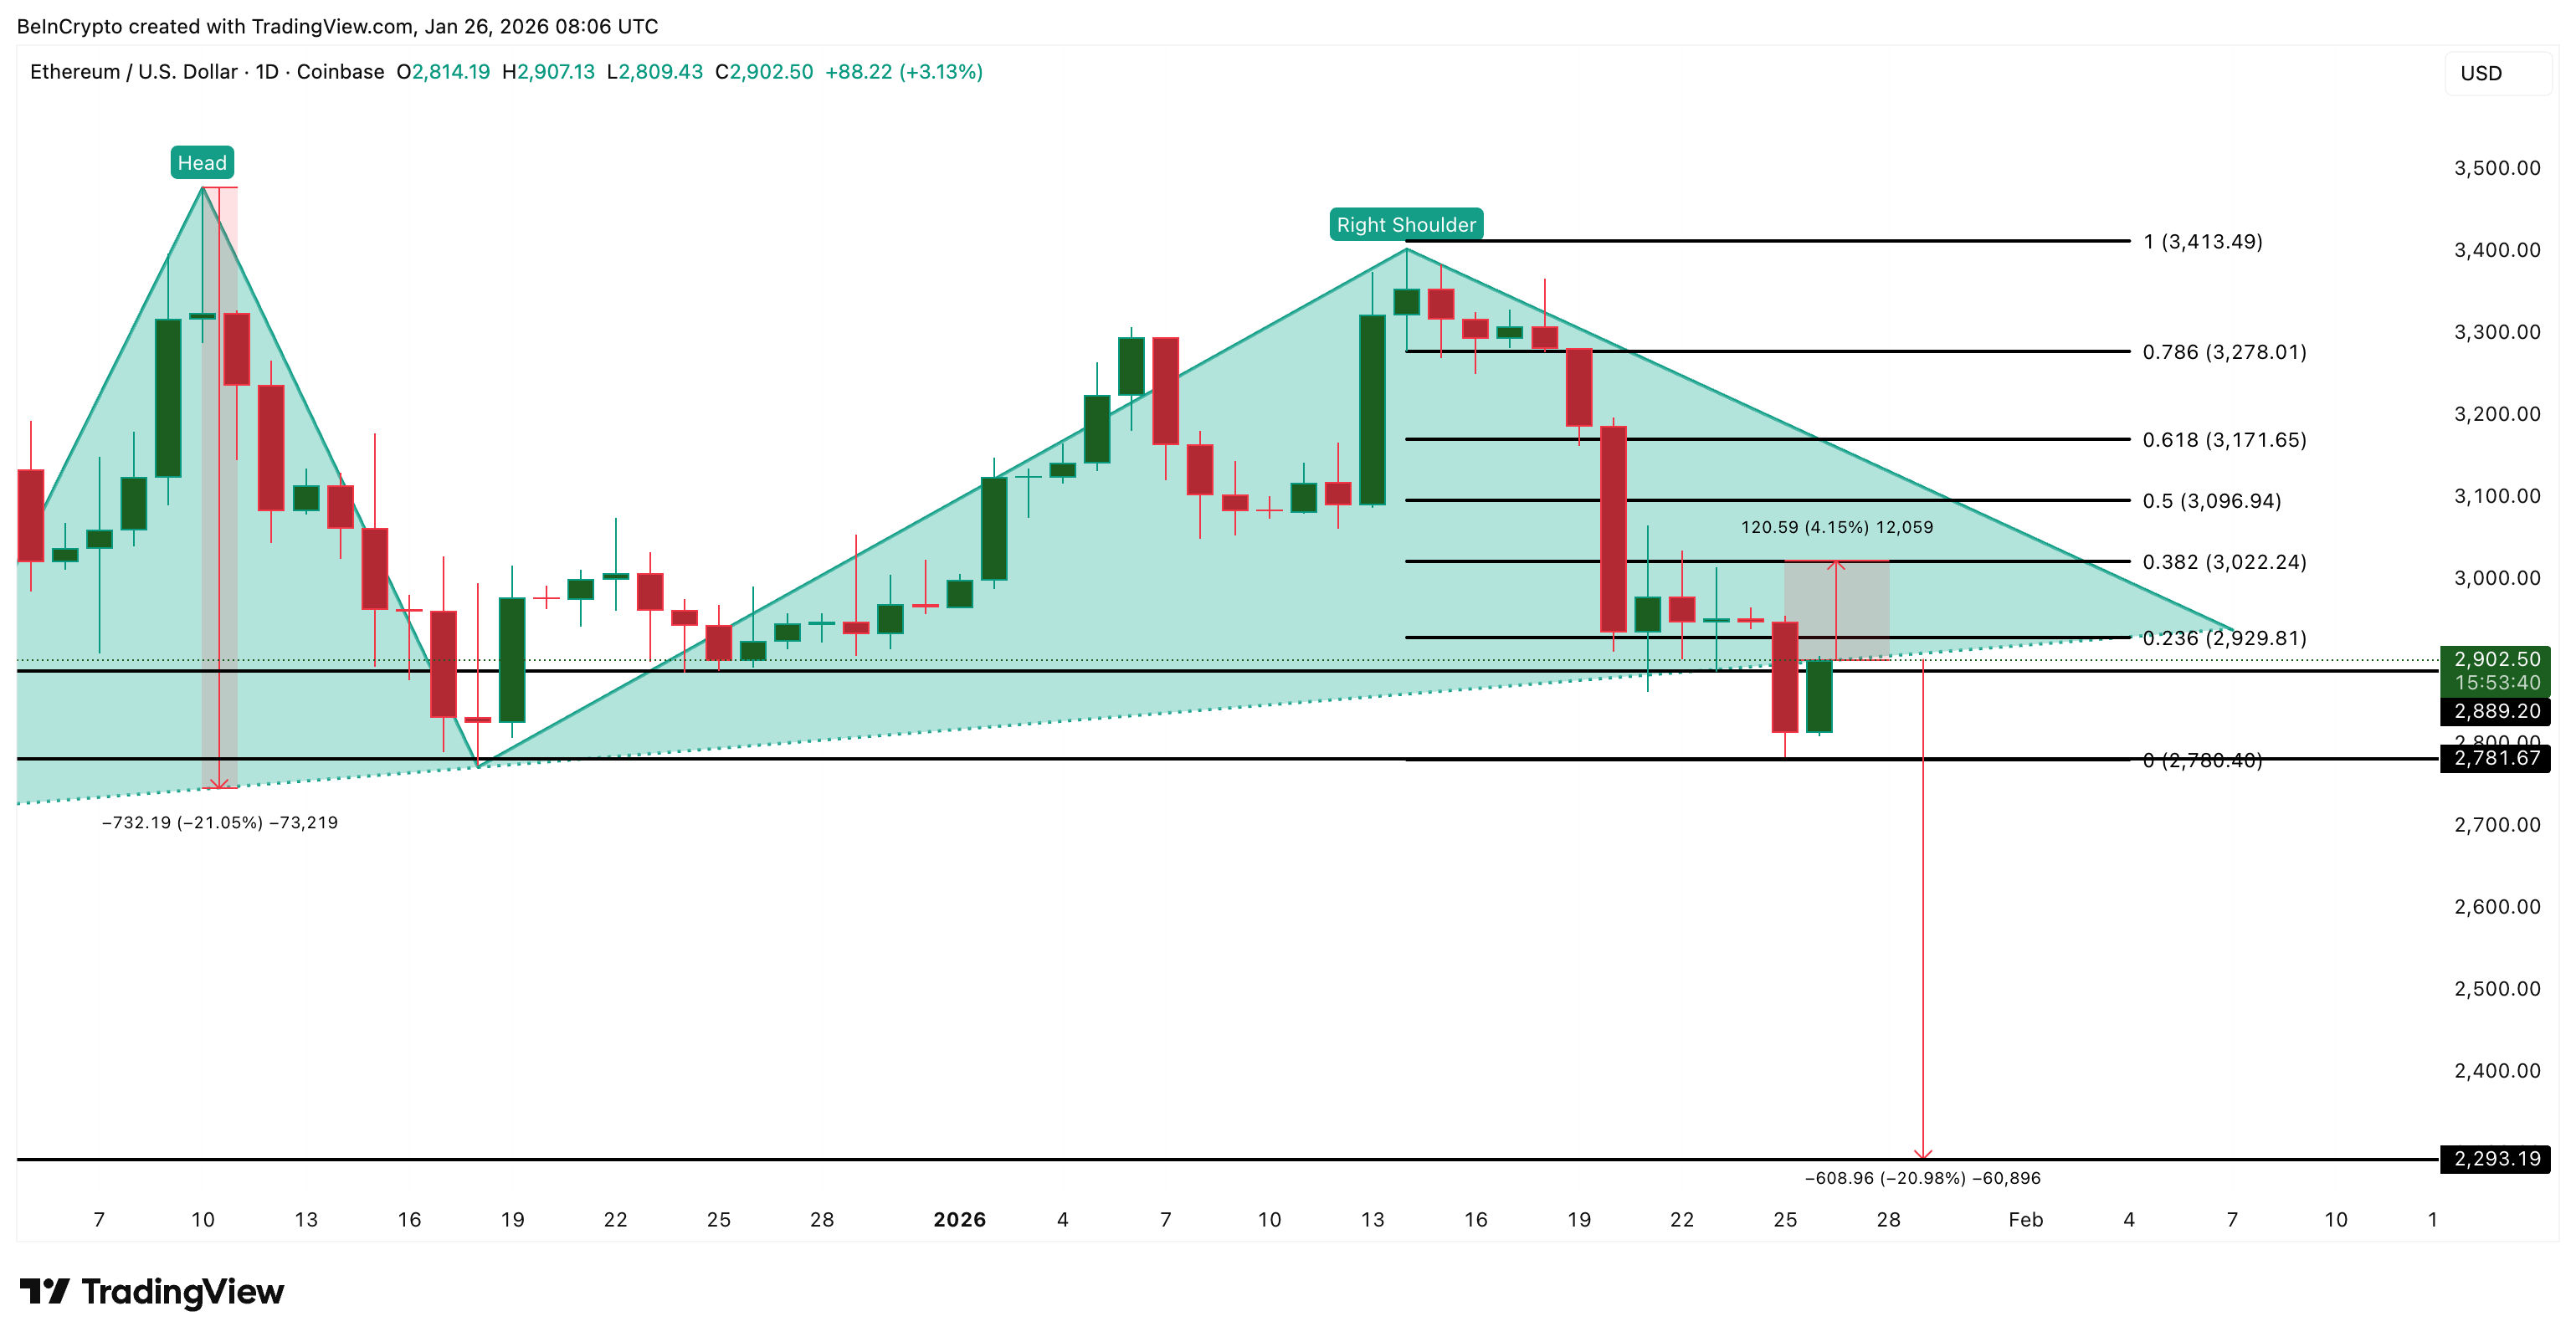
Ethereum has been forming a large head-and-shoulders structure on the daily chart since late November. This pattern typically signals a bearish reversal once the $ETH price breaks below the neckline, which acts as the final support holding the structure together.
That breakdown occurred on January 25, when Ethereum fell below the $2,880 neckline and briefly dipped toward the $2,780 zone. Based on the height of the pattern, this breakdown activates a downside projection of just over 20% if selling pressure accelerates.
However, the move did not extend immediately. After tagging the lows, Ethereum rebounded by roughly 4–5%.
Want more token insights like this? Sign up for Editor Harsh Notariya’s Daily Crypto Newsletter here.
This bounce coincided with visible rotation from Bitcoin into Ethereum, highlighted by large on-chain swaps where $BTC exposure was reduced in favor of $ETH.
WLFI(@worldlibertyfi) is rotating from $BTC into $ETH.
— Lookonchain (@lookonchain) January 26, 2026
About 6 hours ago, @worldlibertyfi swapped 93.77 $WBTC($8.08M) for 2,868 $ETH.https://t.co/kaRan1WMwF pic.twitter.com/yQj8OVHZ8U
Rotation like this often appears near local lows. Traders shift capital into assets that have already corrected, betting on mean reversion. But rotation alone does not define trend direction. To understand whether this rebound is real support or just a pause, we need to look at who is participating.
Whales Sell the Bounce, But Long-Term Holders Step In
Whale behavior helps explain why the rebound has lacked strong follow-through. Whales, defined here as large holders excluding exchanges, used the bounce to slightly reduce exposure rather than add to it.
Since the rebound began, whale-held Ethereum supply slipped from roughly 100.24 million $ETH to about 100.20 million $ETH. This is not aggressive selling, but it shows whales are not treating the rebound as a strong accumulation zone. Instead, they appear cautious, using strength to trim risk.
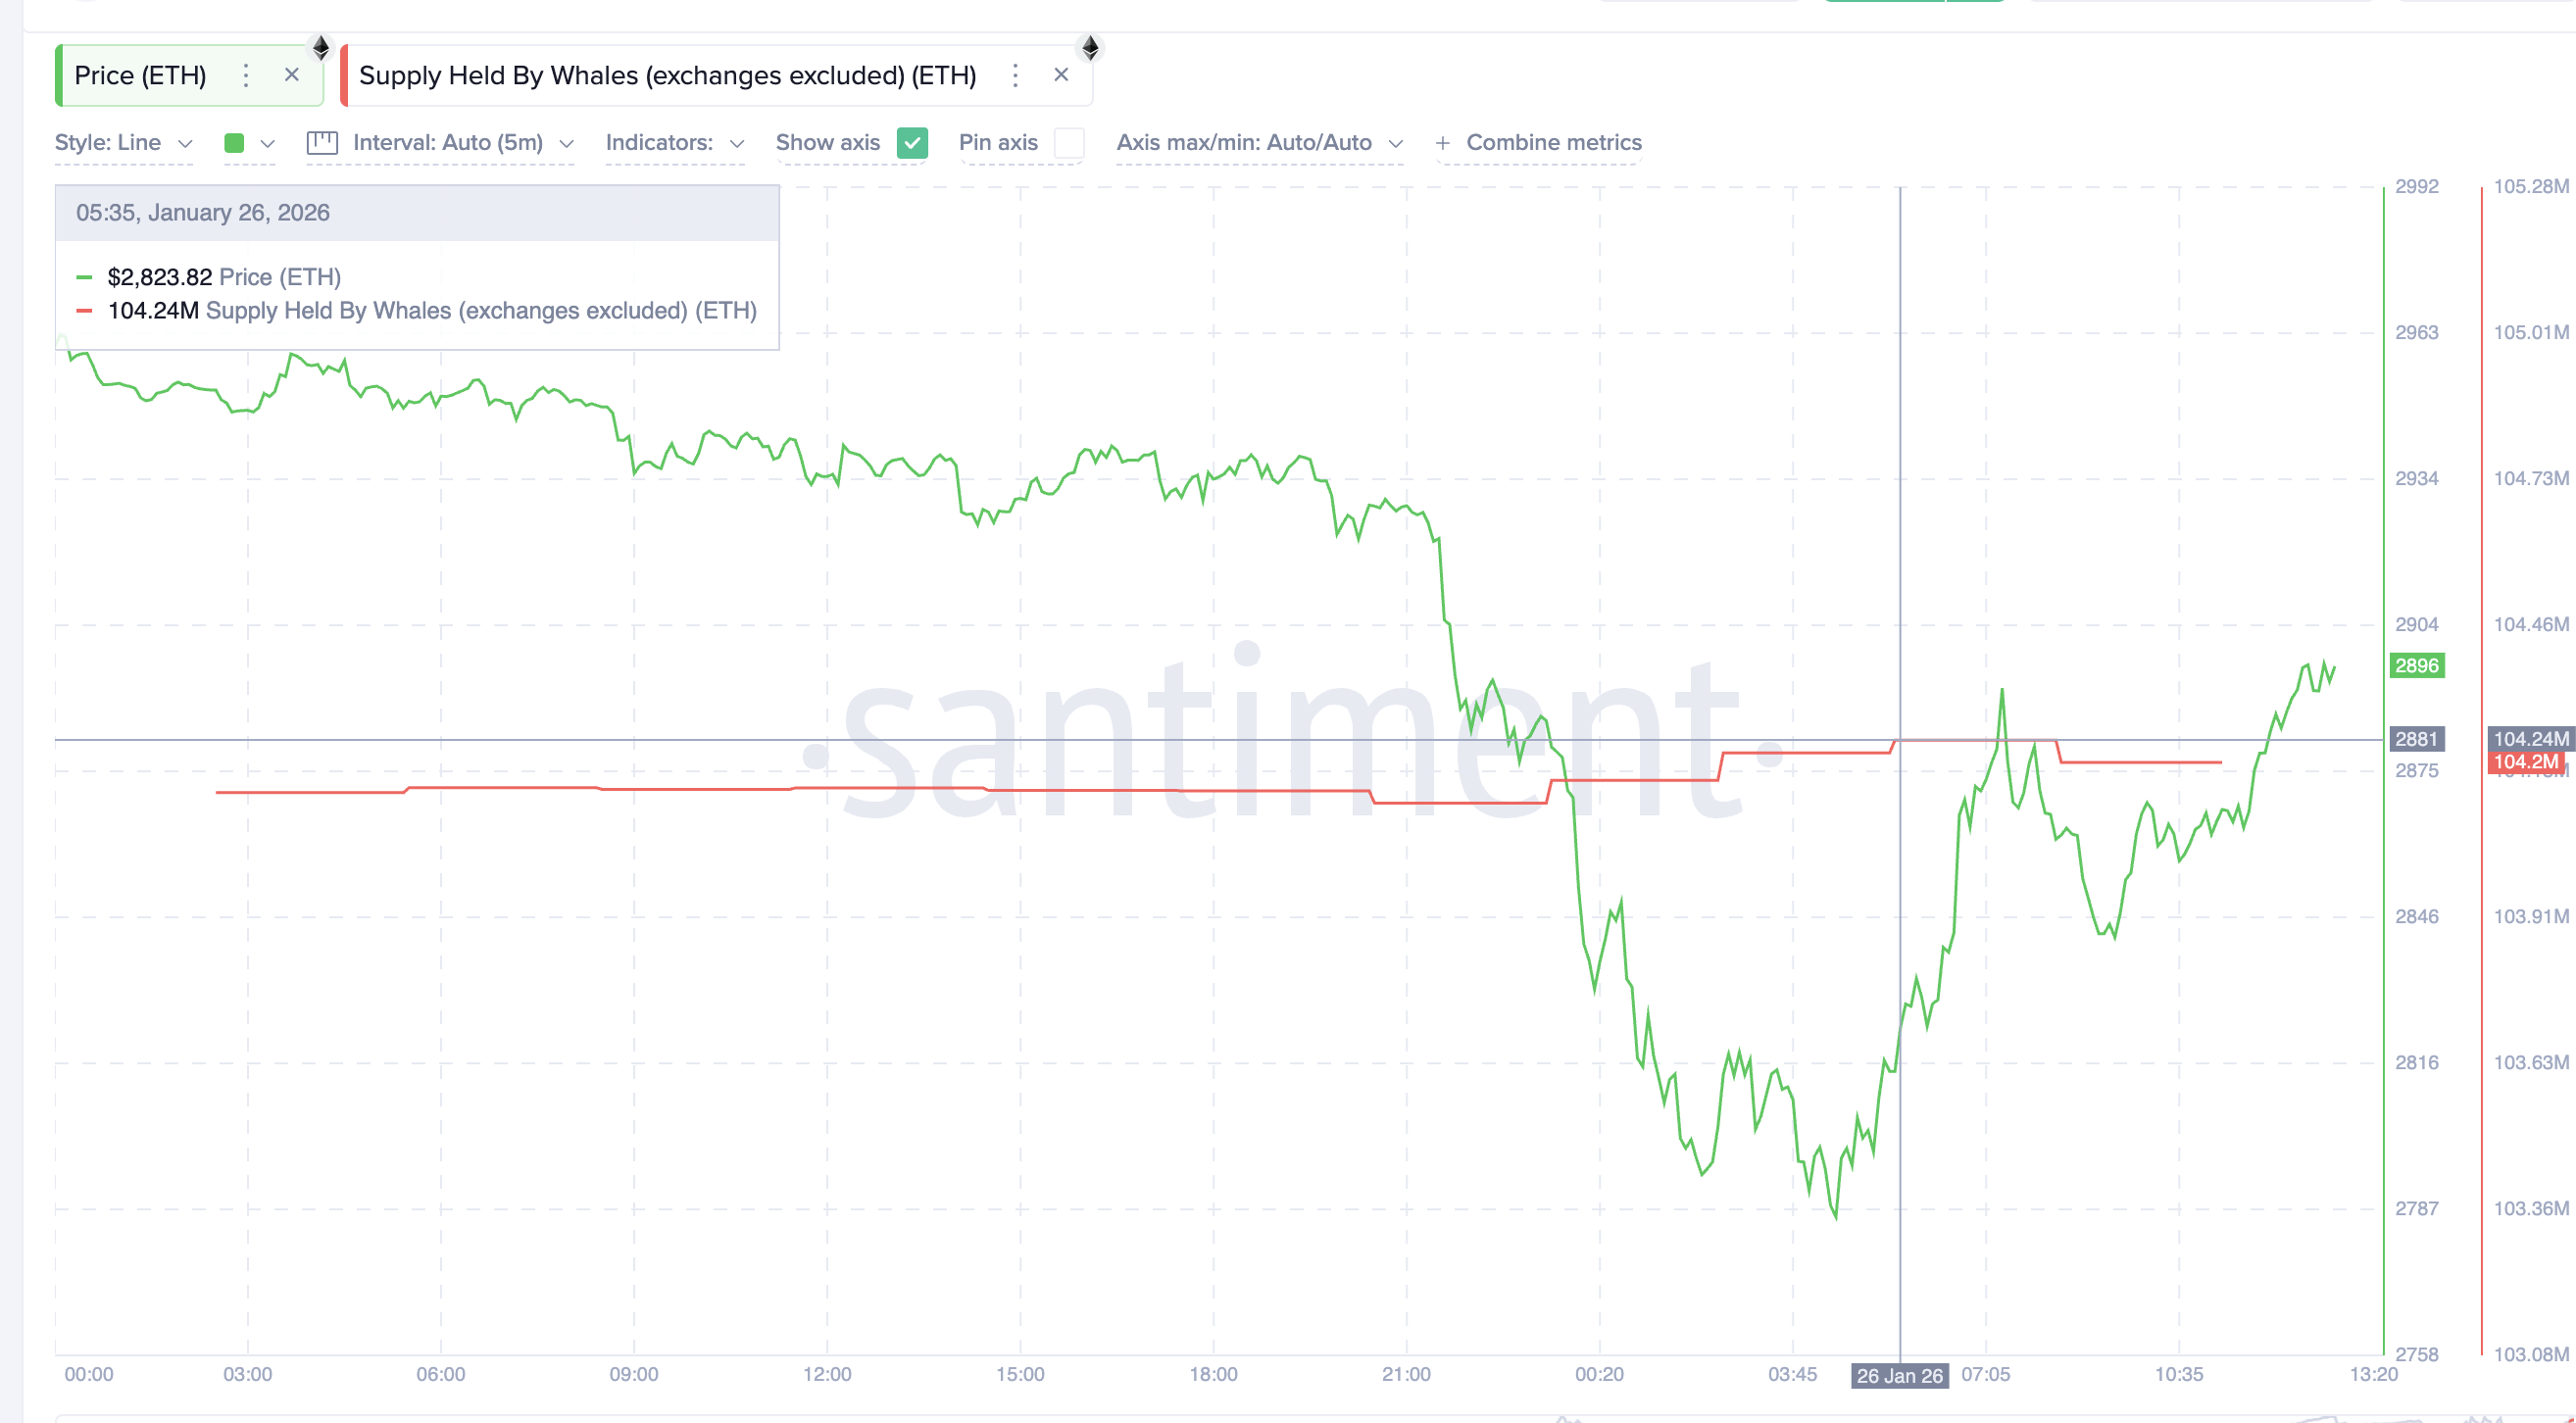
That raises an important question. If whales are not leading the recovery, why hasn’t price rolled over again?
The answer comes from long-term holders. The 6–12 month holding cohort, which represents investors with stronger conviction and lower sensitivity to short-term price swings, has been steadily increasing its share. Since January 23, this group has grown from about 17.23% of supply to roughly 18.26%.
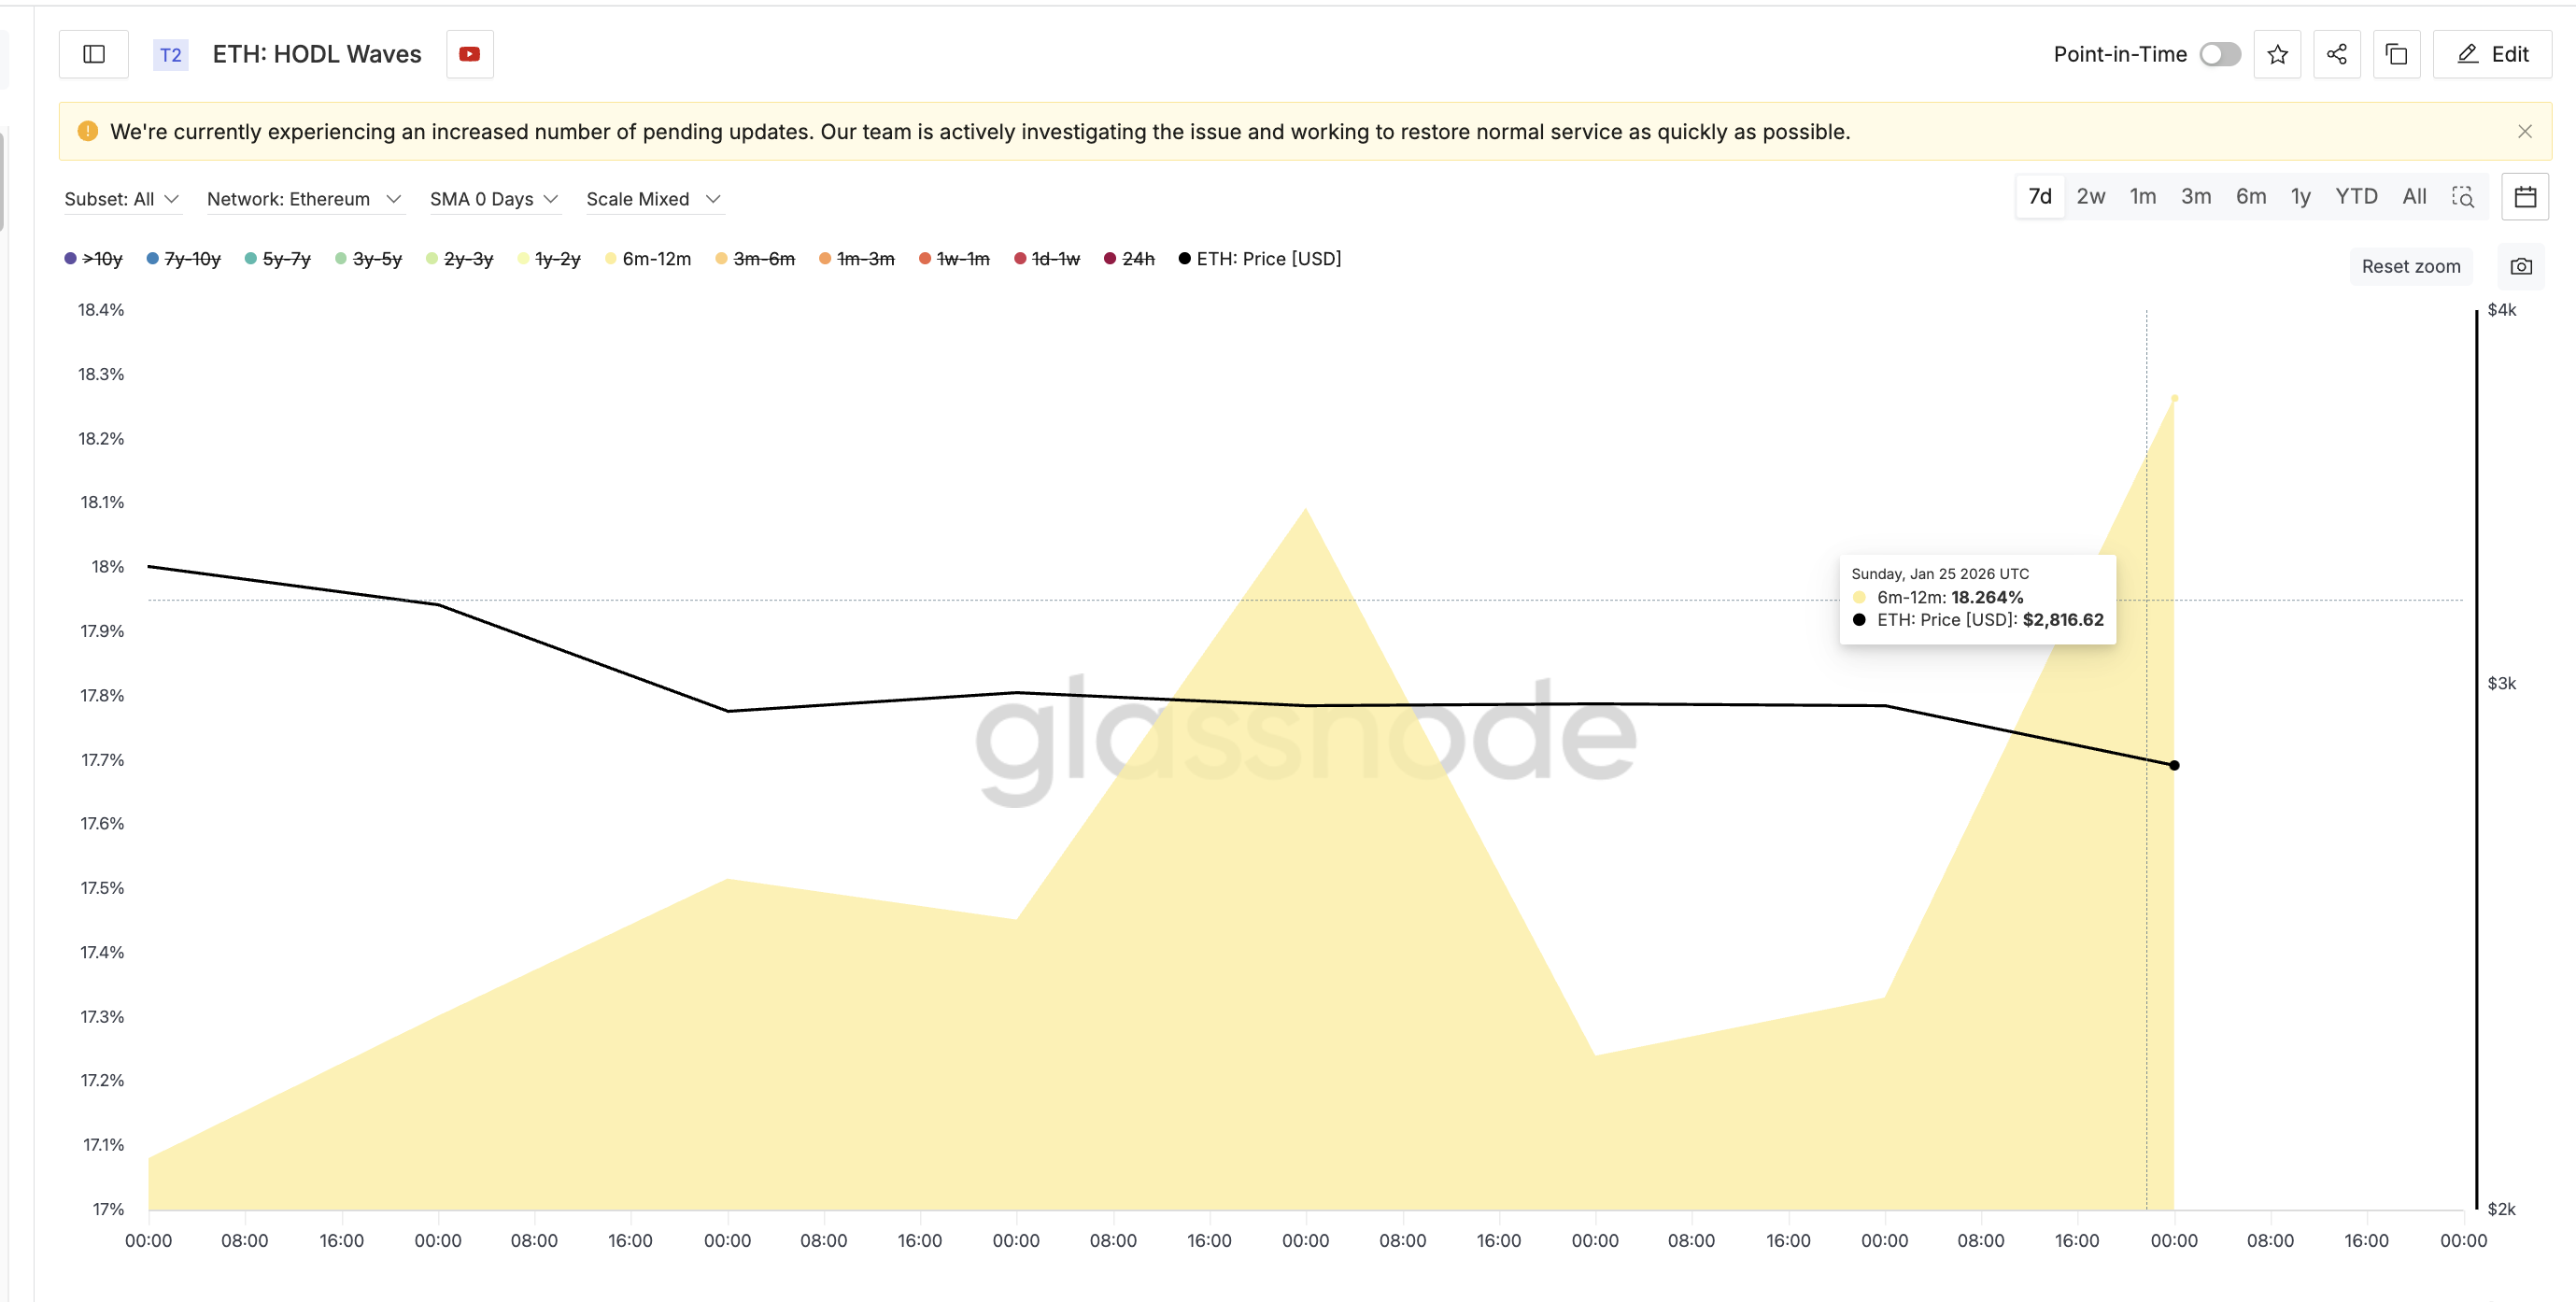
In simple terms, $ETH whales are selling bounces, but long-term holders are buying dips. This transfer of supply explains why Ethereum stabilized after the breakdown rather than immediately collapsing. It also sets the stage for the next risk layer: derivatives positioning.
Short Crowding Raises Bear-Trap Risk as Ethereum Price Tests Key Levels
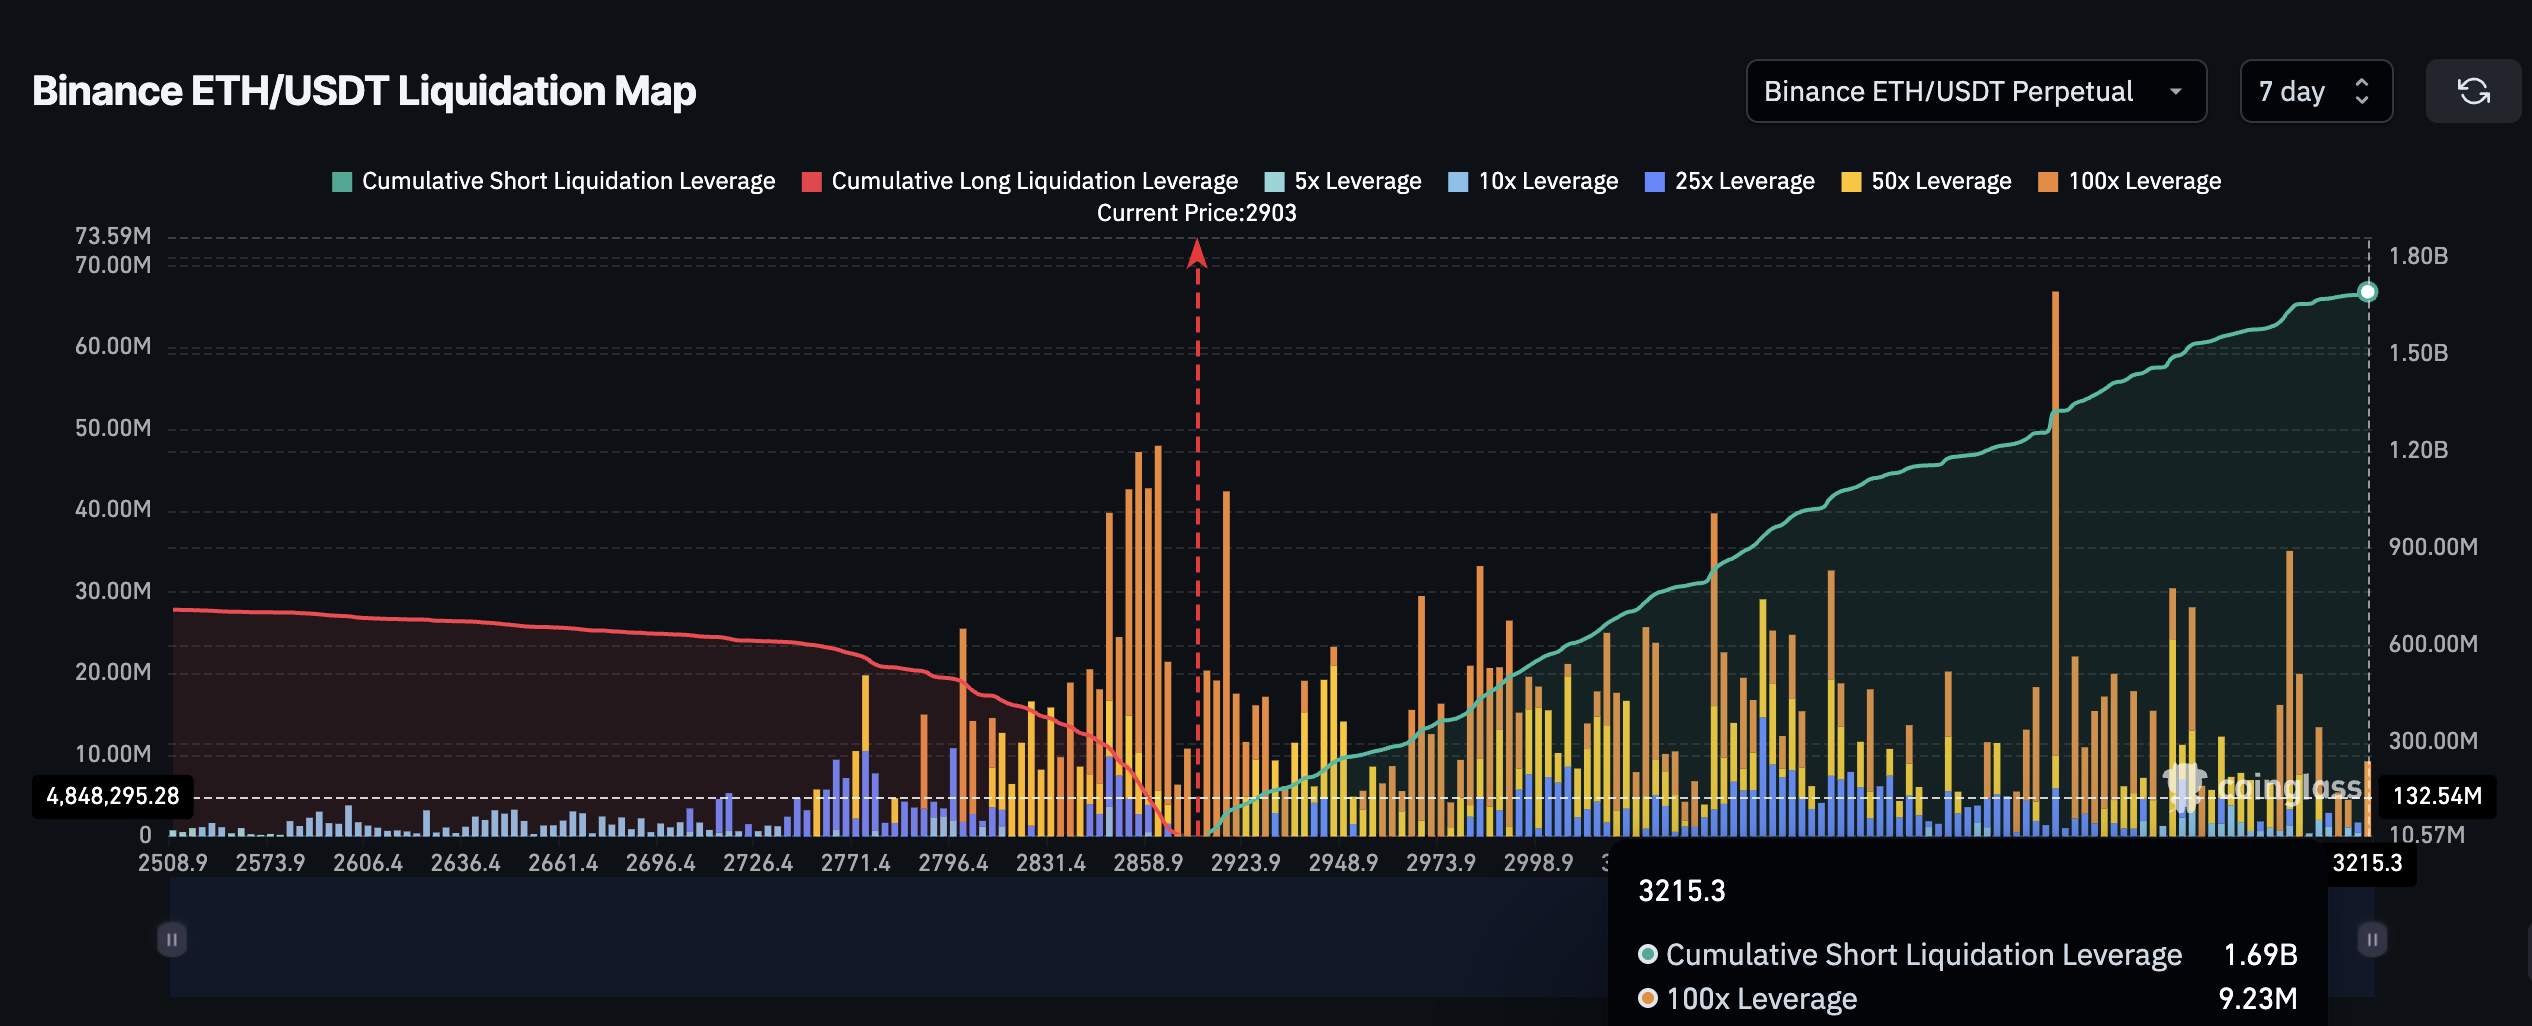
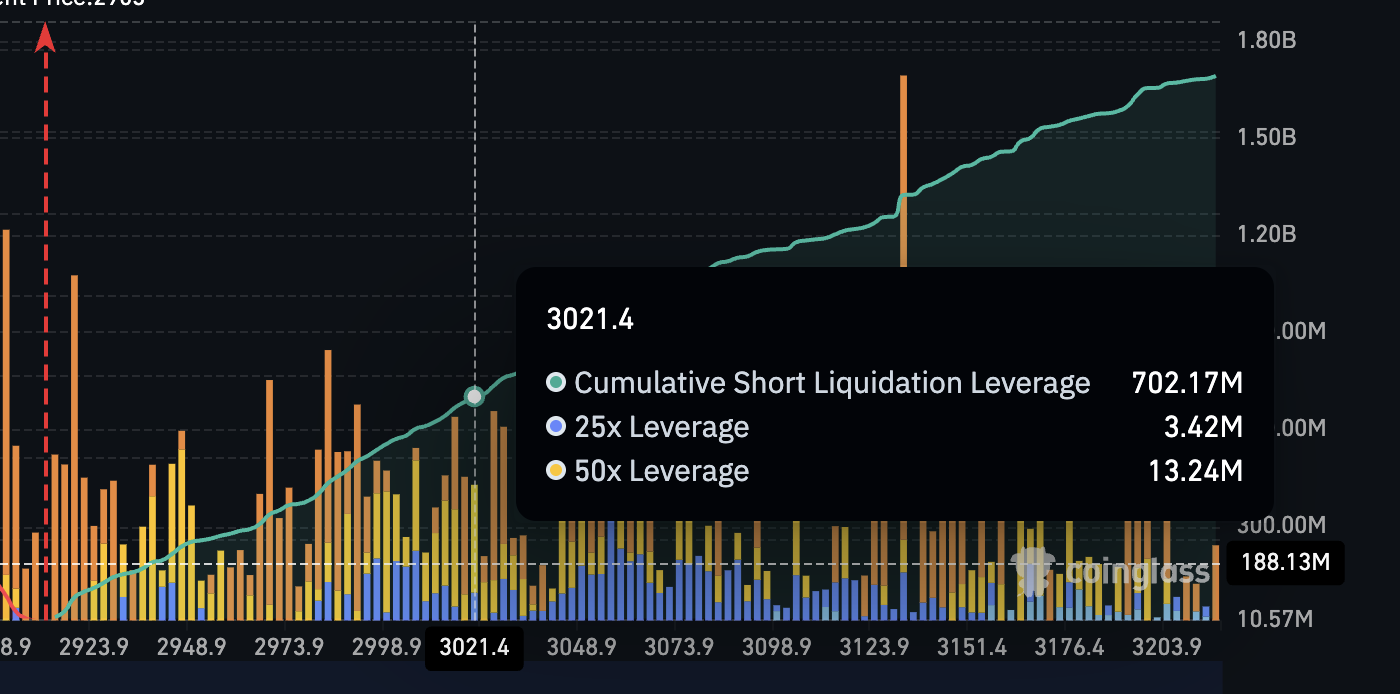
Derivatives data shows why the market is now extremely sensitive to small price moves. Liquidation leverage measures how much forced buying or selling would occur if the $ETH price moves to certain levels.
On Binance’s $ETH-USDT perpetual market, cumulative short liquidation exposure over the next seven days sits near $1.69 billion. Long liquidation exposure is closer to $700 million. That means shorts outweigh longs by well over 100%.
 $ETH Liquidation Map">
When too many traders position for downside after a breakdown, even a modest price rise can force short sellers to close positions by buying back $ETH, pushing the $ETH price higher, via ‘short squeeze’.
Key levels now define whether this becomes a bear trap or a continuation lower.
An Ethereum price move above $3,020 would begin liquidating a large portion of short positions, potentially forcing over $700 million in short covering. Above that, $3,170 and $3,270 become the next squeeze zones. Clearing $3,270 would eliminate all the current short-side pressure.
For the bearish structure to meaningfully weaken, Ethereum would need to reclaim $3,410, which marks the right-shoulder high.
On the downside, the risk is still clear. A clean loss of $2,780 would reaffirm the neckline break and reopen the path toward the full 20% downside target near $2,300 ($2,290 to be exact).
Ethereum is now caught between structure and positioning. The chart warns of a 20% crash, and whales are not stepping in aggressively. At the same time, long-term holders are accumulating, and shorts are heavily crowded.
If rotation from Bitcoin continues and price pushes above $3,020, the market could flip quickly as forced buying takes over. If that fails and support at $2,780 breaks again, the bearish projection remains fully active.
The post Ethereum Price Chart Warns of a 20% Crash— Can $BTC-to-$ETH Rotation Stop It? appeared first on BeInCrypto.