Sometimes strength becomes a decisive factor in the struggle for power. ETH buyers have undertaken to confirm this fact by keeping the global trend line. In the weekly timeframes, we see that for several weeks now, candles are fighting for the opportunity to continue the growth trend in the future. Twice sellers managed to break the trend line (late January and late February). However, in the end, buyers retained control and confidently fix to the $2,500 mark. The trading volumes on the weekly candle from 21 February was the highest since September 2021. 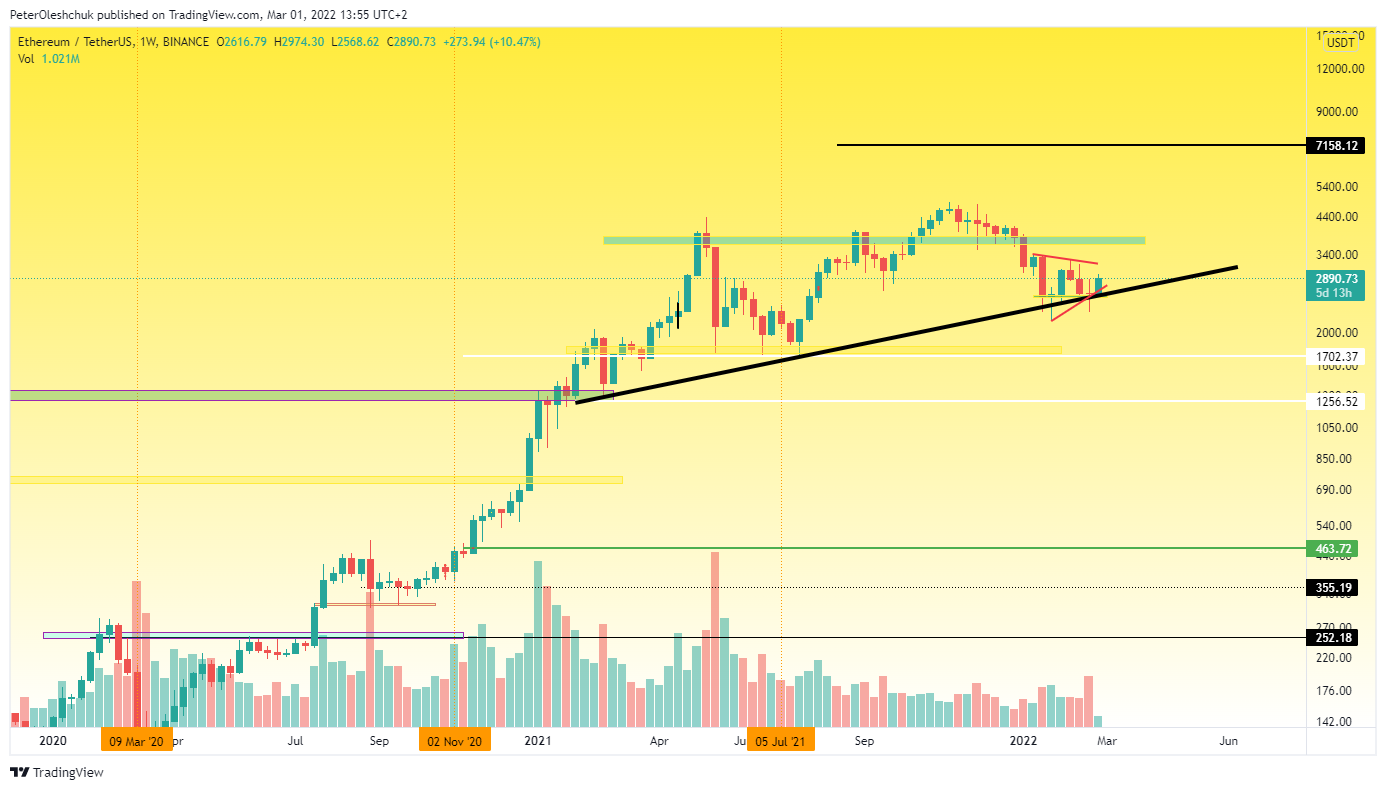 https://www.tradingview.com/x/dEsqGa3n/ However, given the trading volumes during the growth wave from January 2021, these are flowers. However, the local increase in trading volumes and the emergence of low-volatility candles with pins down signals us about the medium-term reversal of the ETH market. Moreover, on increased volumes, sellers failed to update the previous local low from 24 January. In our previous analysis, we wrote that we expect a rebound in the ETH price with the first target of $3,200. But, given the dynamics of price growth this week - this mark may be the first target. In the case of taking control of the $3,200 mark, our main target at the moment is the $3,700 mark. Given the fact that this mark was initially punched by sellers for 7 weeks down, this is a serious obstacle to a new growth wave. An alternative scenario in the ETH market will take effect if the price remains below $2,500. And in this case, the scenario of falling ETH to $1700 will become real again.
Technical Analysis Of ETH On The Daily Timeframe
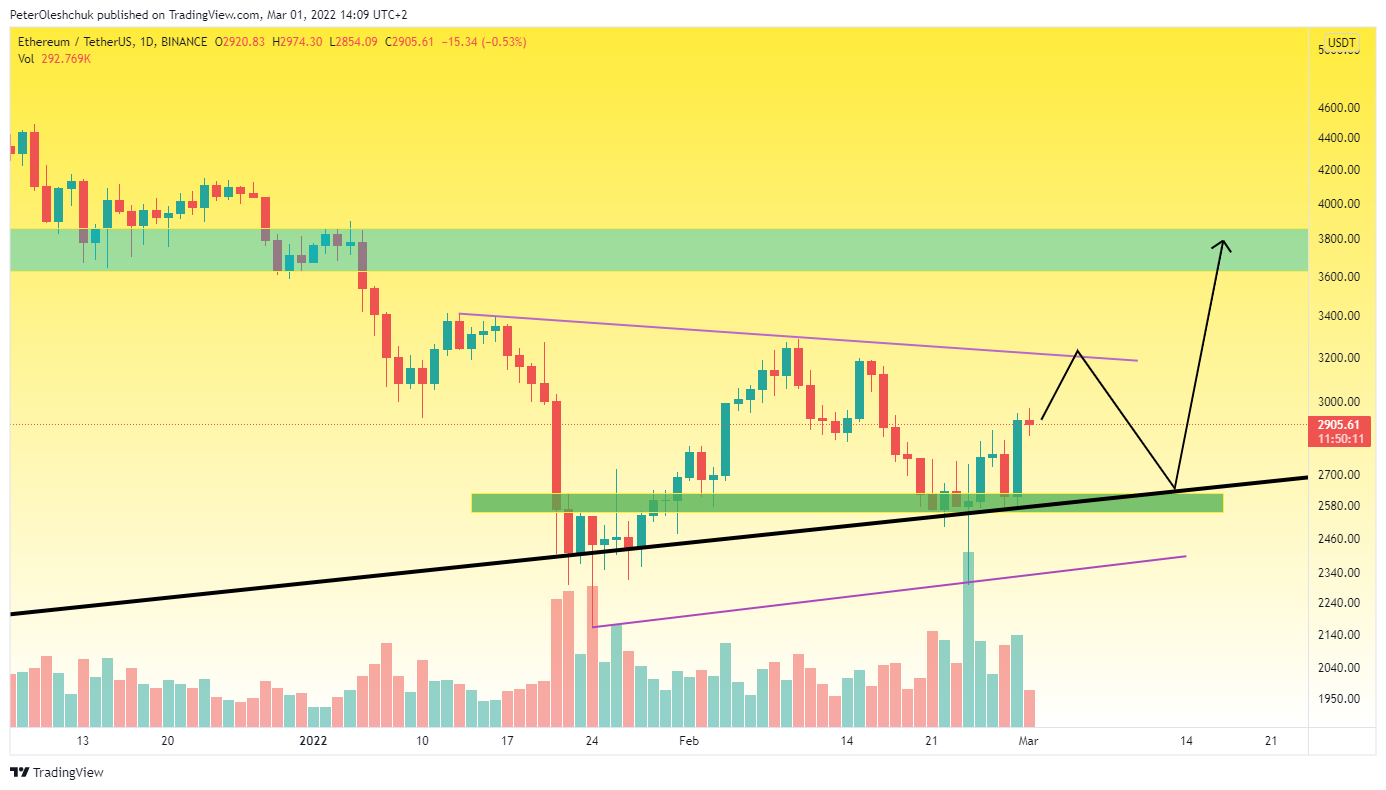 https://www.tradingview.com/x/q7vivQcF/ Analyzing the ETH price movement on the daily timeframe, we can see a significant increase in trading volumes from 21 February. Given the protracted ETH price fall wave and stopping it for 39 days, we conclude that buyers are gaining ground. We do not rule out the fact that after meeting the $3200 mark, the ETH price may fall again in the range of $2,500-$2,600. Though, in this case, it will be a good time to buy ETH with little risk and the target of $3,700. The chart also shows that the lower trend line of the triangle is below the liquidity range of $2,500-$2,600. A fall of the ETH price to $2,200 will reduce the probability of a consolidation breakdown and will call into question the strength of buyers.
The ETHBTC Price Is Intriguing And Hints At A Fall
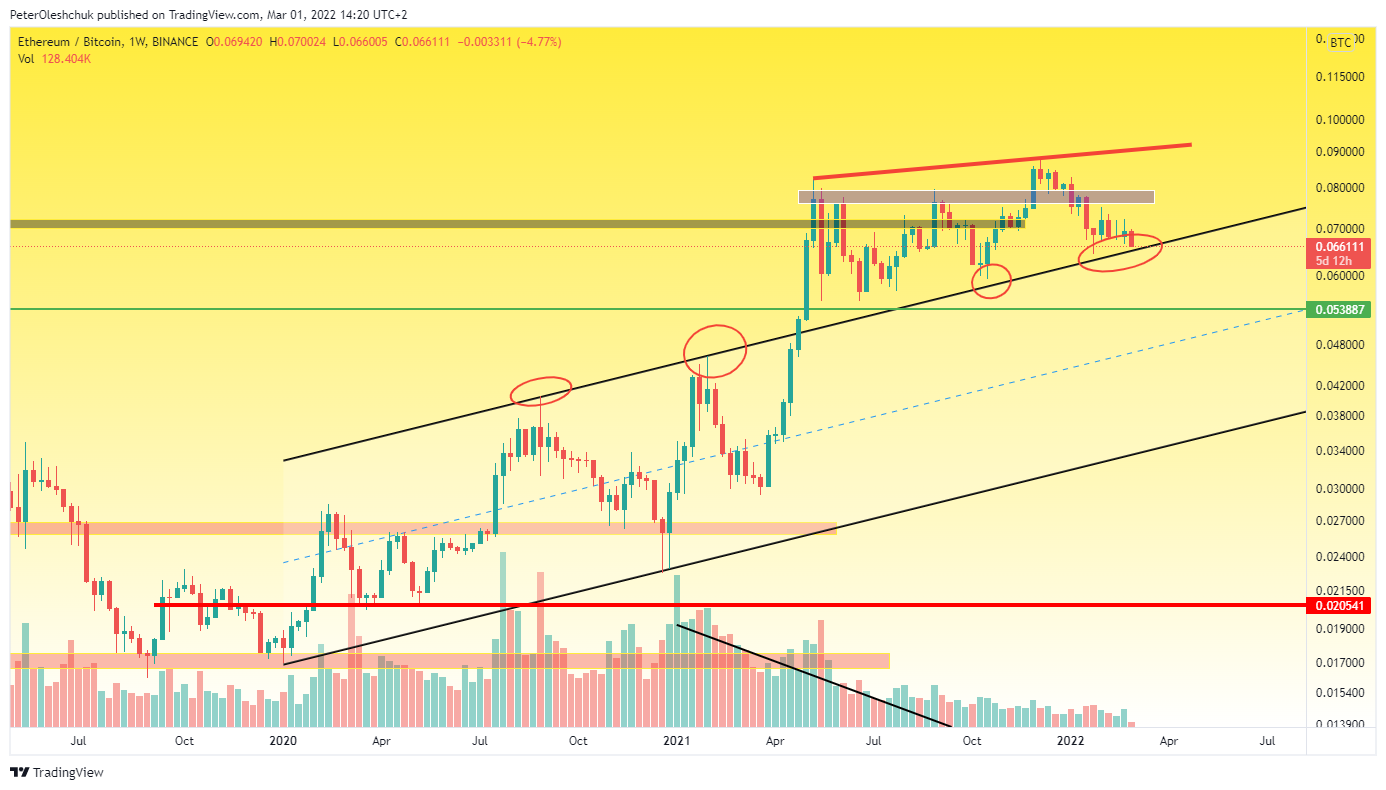 https://www.tradingview.com/x/pkypEl5I/ However, not everything is as smooth as we would like. On the weekly ETHBTC price chart, we see a continuation of the decline and a test of the trend line of the former growth channel. Everything takes place on small volumes. Why such a difference in price sentiment? The fact is that now investors are more watching Bitcoin and investing in it. This is confirmed by the Bitcoin dominance chart, which we published in the article. Therefore, a slight fall wave of the ETHBTC price at low volumes will not prevent the ETHUSDT price growth. However, this requires an active phase of BTC price growth.