
Ethereum must stay above the key SMA level to maintain bullish momentum, with mixed futures flows indicating volatility.
Ethereum ($ETH) has seen a 1.2% increase in the last 24 hours, pushing its price to $3,235.25. Notably, the price fluctuated between $3,160.13 and $3,267.70 during this period.
Over the past week, Ethereum has shown a 3.5% increase, while its 14-day performance shows a modest rise of 5.7%. However, the 30-day performance remains down 7.0%.
Despite the short-term gains, the market is showing signs of exhaustion, with bulls struggling to maintain control. Unless stronger momentum steps in, Ethereum may risk rolling back into its previous range.
The market cap stands at $390.38 billion, and the 24-hour trading volume of $24.5 billion indicates solid activity, but Ethereum is at a critical juncture. The next few days will determine whether Ethereum can break free from its current range or if it will experience a reversal.
Ethereum’s Key Support and Resistance Levels
Per technical charts, Ethereum’s price is hovering just above the 9-day Simple Moving Average (SMA) of $3,166.96, indicating that Ethereum is attempting to maintain its recent bullish momentum. The second-largest crypto is testing the upper part of its range, and its ability to hold above the SMA level could signal further upward movement.
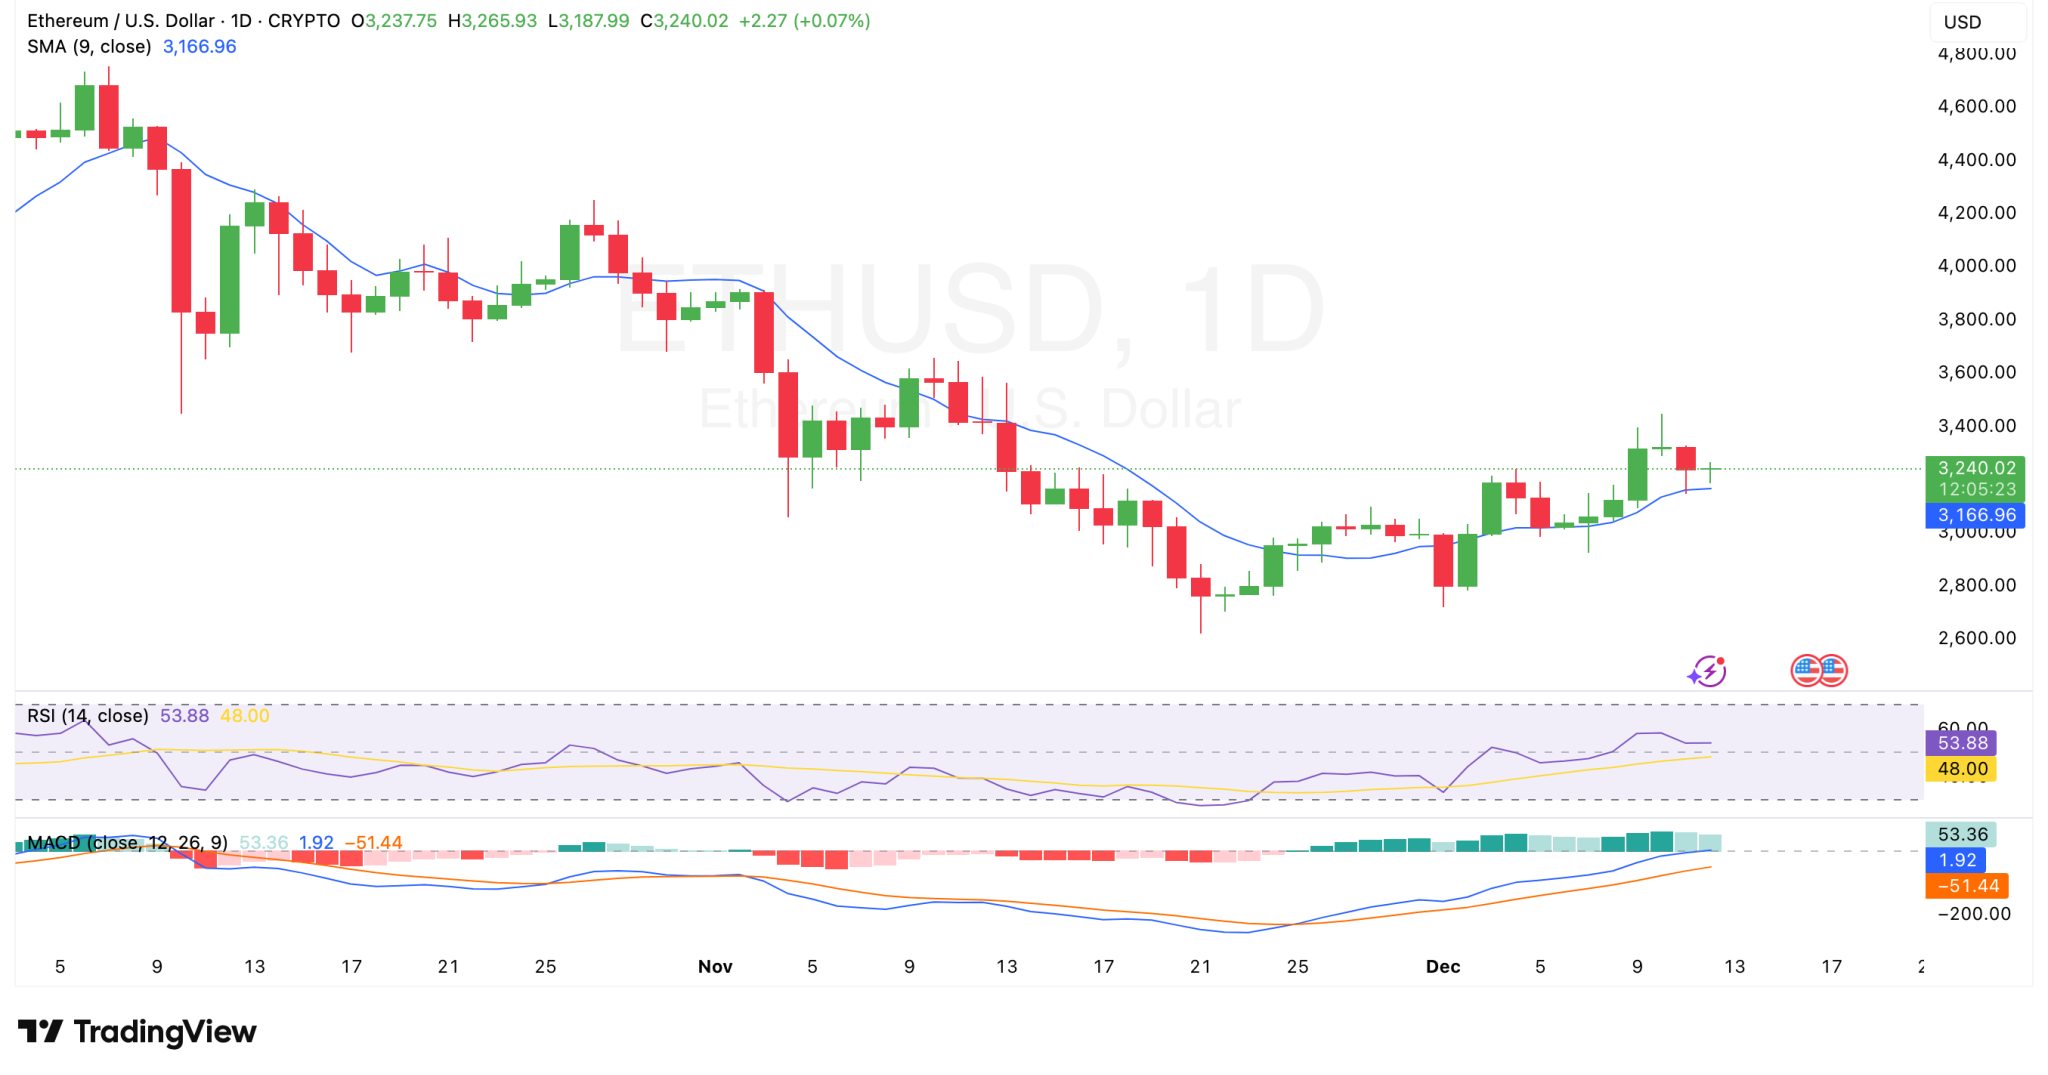
The Relative Strength Index (RSI) is currently at 53.88, suggesting that Ethereum is neither overbought nor oversold, providing room for potential price action in either direction.
With the RSI hovering just above the neutral 50 mark, Ethereum appears to be in a consolidation phase, waiting for further momentum. If the RSI continues to move higher, it could signal that Ethereum is gearing up for a breakout, potentially targeting the next resistance zone.
The MACD (Moving Average Convergence Divergence) indicator also shows a positive value of 53.36, with the MACD line above the signal line, suggesting bullish momentum. The histogram is also in the positive, showing a growing buying interest.
This, combined with the RSI’s neutral reading and the price’s position above the SMA, points to a potential upward move if Ethereum can break through its immediate resistance levels like $3,600. However, if the price falls back below the 9-day SMA, it could indicate a retreat toward lower support levels.
Ethereum Facing Futures Outflows
On the flip side, futures flows data for Ethereum shows a mixed trend across different time frames, indicating heightened volatility in the market. In the last 30 minutes, Ethereum experienced a small net outflow of $7.69M, with inflows of $104.82M and outflows of $112.51M, resulting in a negative change of 143.39%.
However, the 1-hour data shows a more positive outlook, with a net inflow of $10.03M, a 107.52% increase, signaling renewed buying interest.
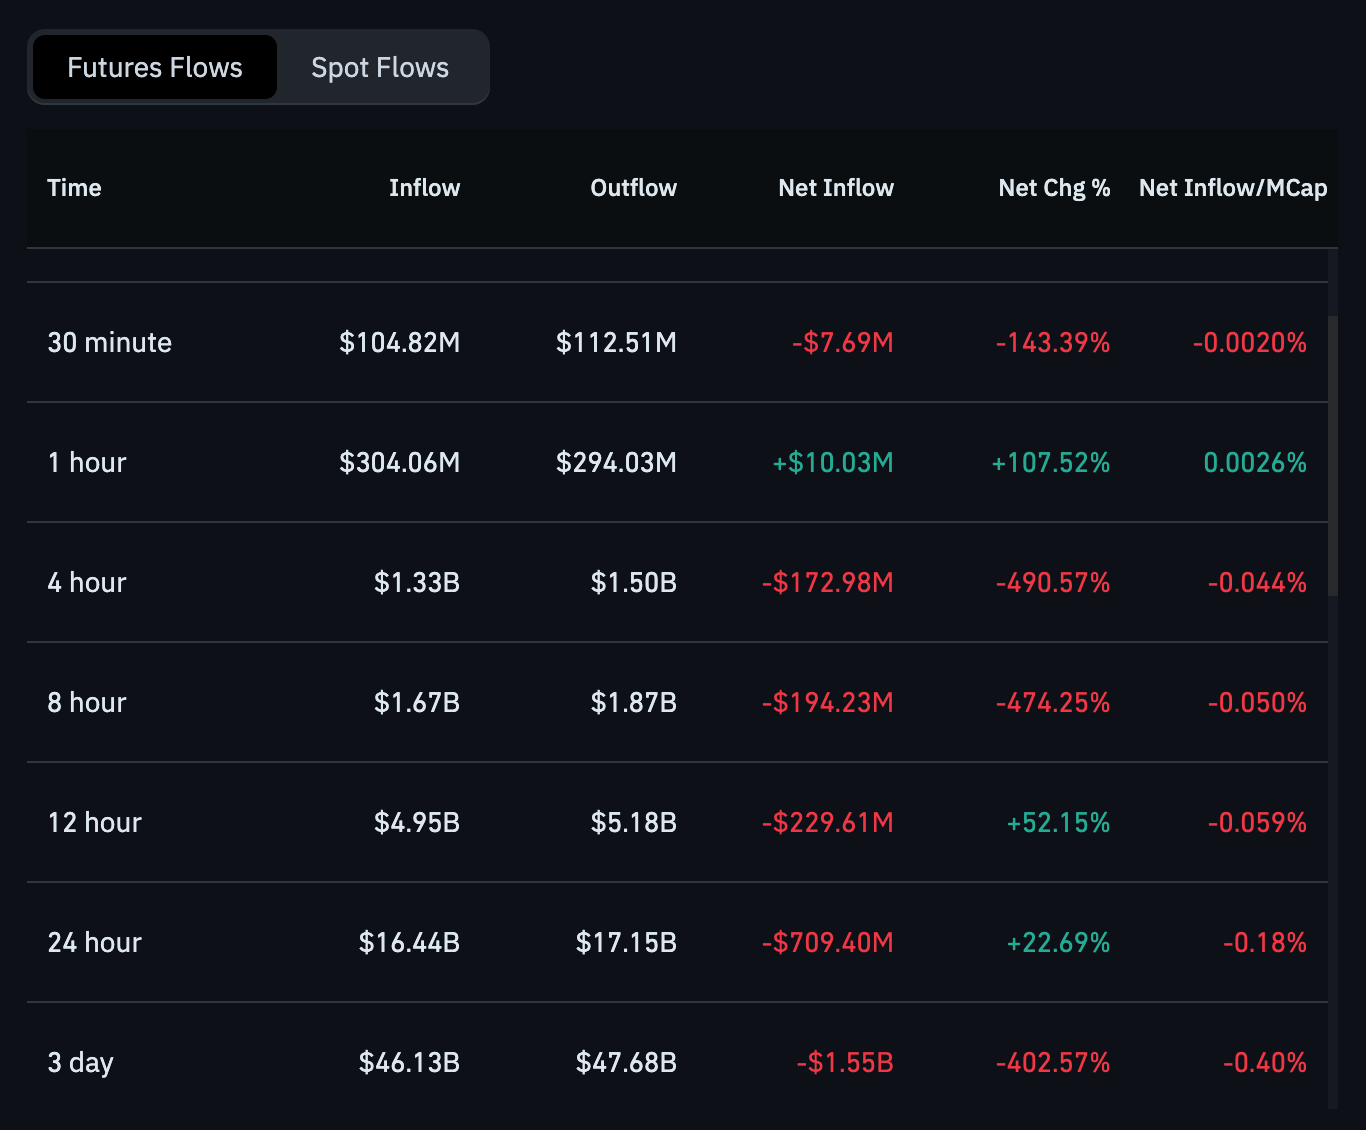
Looking at the longer time frames, the 4-hour, 8-hour, and 12-hour data indicate a more bearish sentiment. Over the 4-hour period, Ethereum saw a net outflow of $172.98M (down 490.57%), and the 8-hour period also saw a similar decline with a net outflow of $194.23M (down 474.25%).
The 12-hour period showed a slight improvement with a net inflow of $5.18M. The 24-hour data reveal a net outflow of $709.40M, and the 3-day data shows a larger outflow of $1.55B.