
Ethereum price is breaking through major support levels, falling below key high-time-frame zones and signalling increasing downside pressure that may mark the early stages of a deeper bearish cycle.
- ETH now sits inside a lower trading range with weakened momentum
- Any bounce is likely to form a lower high within the downtrend
- Market structure suggests further downside toward the $2,100 support zone
Ethereum’s (ETH) price action has entered a decisive phase as the market breaks beneath major structural support zones that once anchored bullish momentum. With Ethereum now trading below the $3,500 region, several high-time-frame levels have flipped into resistance, and the broader trend is beginning to resemble the early stages of a bear market.
Ethereum price key technical points
- Ethereum has broken below major high-time-frame support and now trades under $3,500
- The $3,500 level has flipped into resistance alongside the 200-day moving average
- Downside targets include $2,600 for a bounce and $2,100 as the larger range low
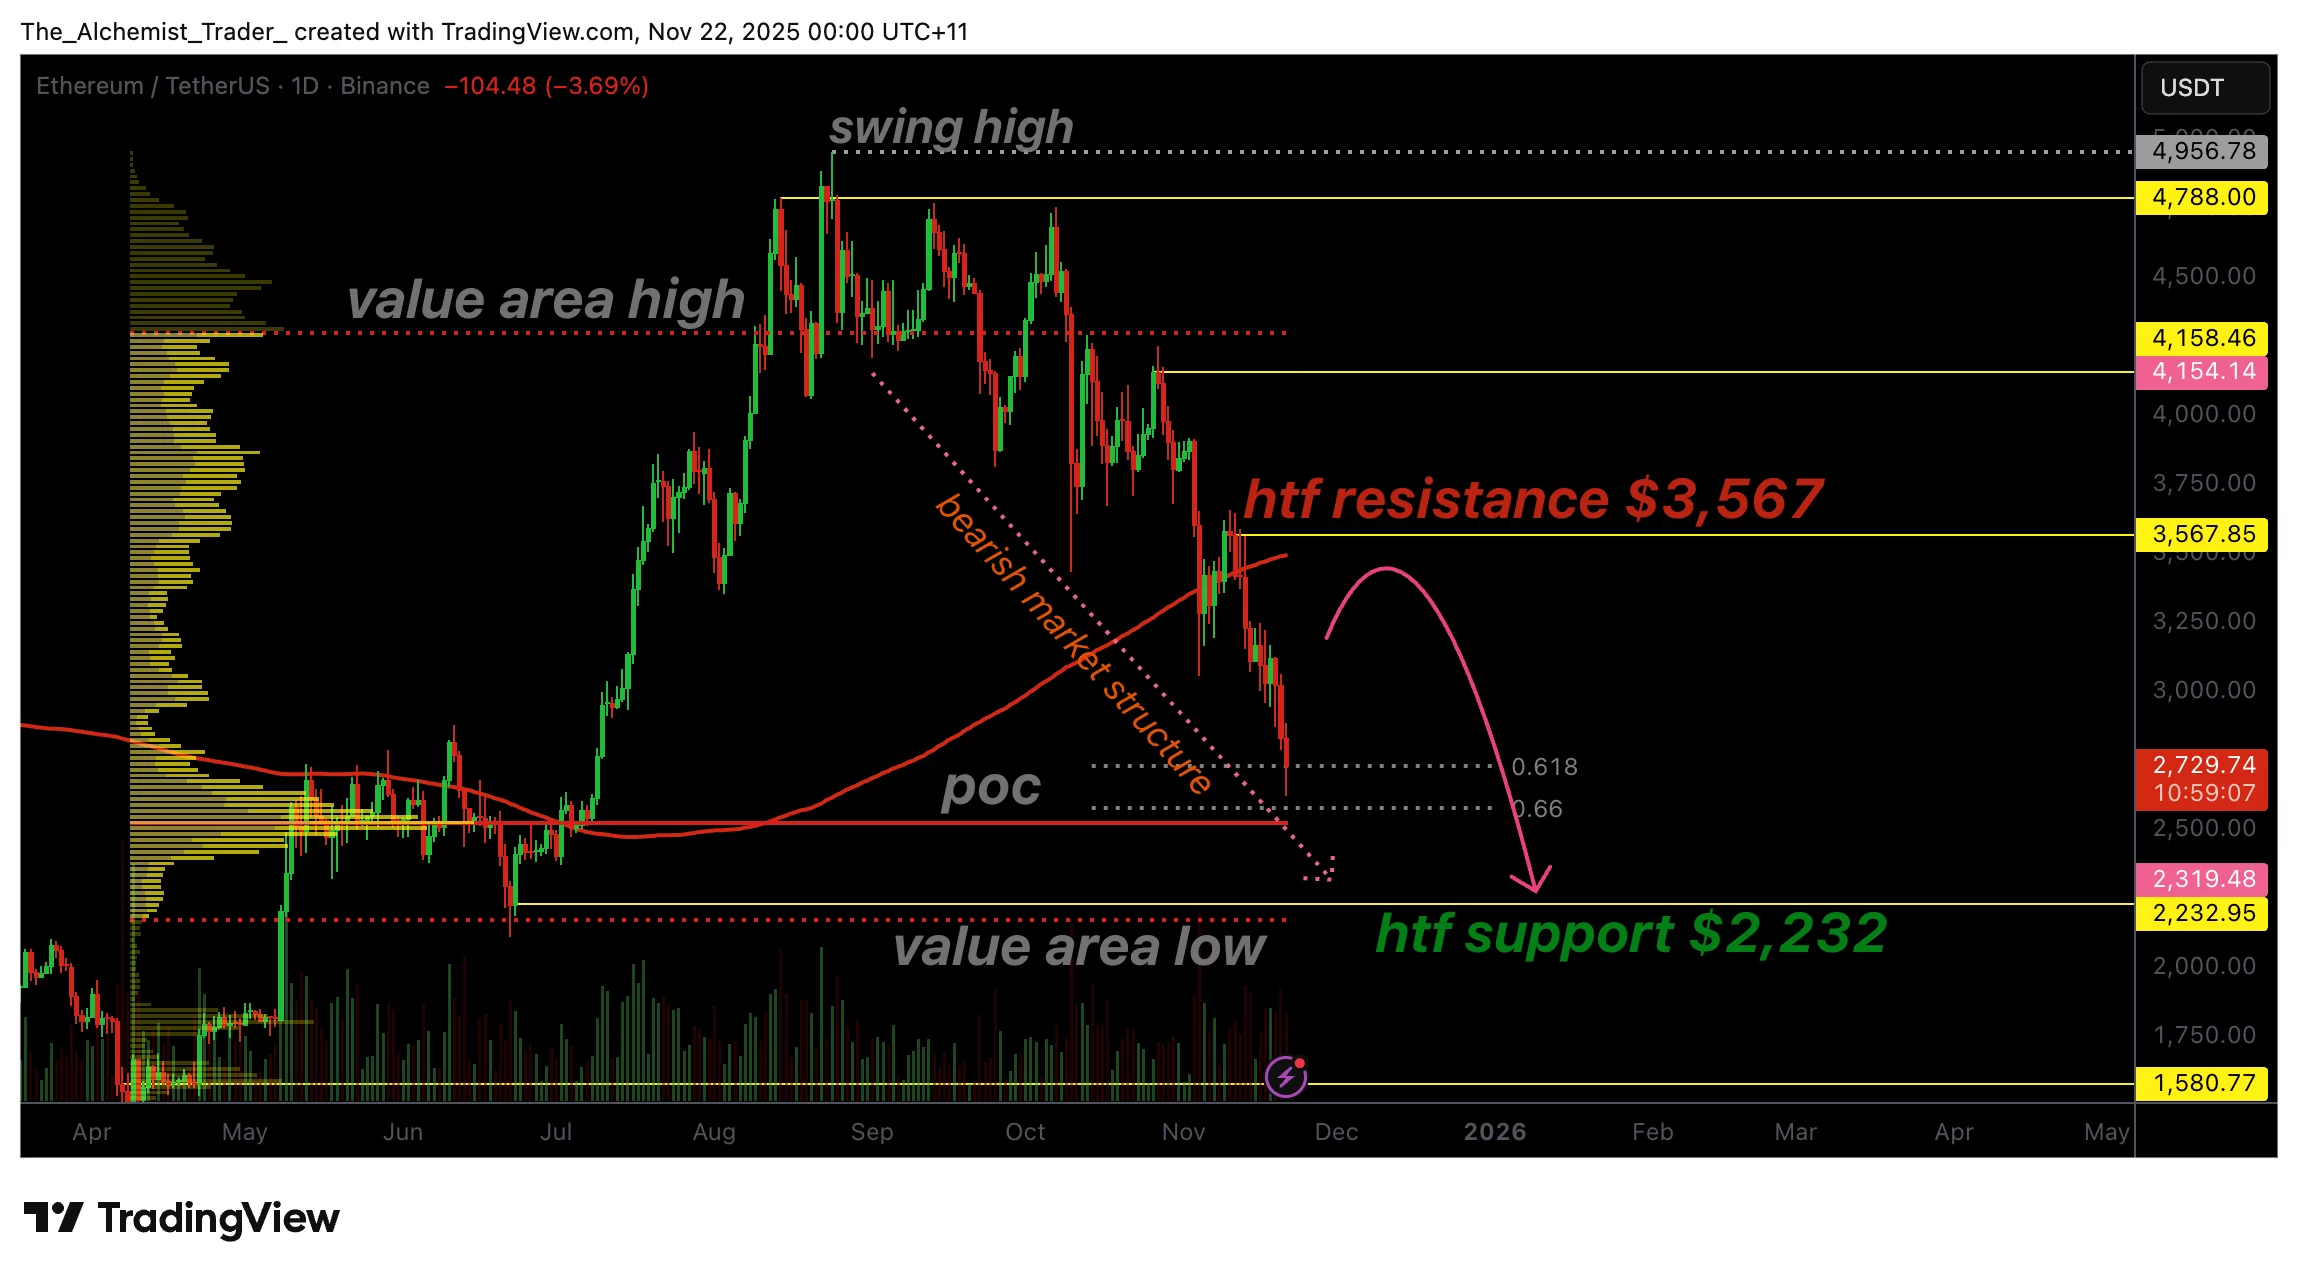
Ethereum’s recent breakdown below the $3,500 zone is one of the most significant structural shifts of its current cycle. This level previously acted as strong high-time-frame support but has now flipped into resistance. The 200-day moving average has also aligned with this region, reinforcing the bearish transition and confirming that ETH is trading beneath key trend indicators.
Price has already accelerated lower after the breakdown, pushing ETH toward the $2,600 region. This zone is historically reactive and may generate an oversold bounce. However, such a bounce would likely form nothing more than a lower high within the broader bearish structure. Ethereum has been printing a sequence of lower lows and lower highs, which is characteristic of sustained downward momentum.
Even if a relief rally occurs from $2,600, the technical landscape still favours further downside. The larger objective from a structural perspective remains the $2,100 range low. Ethereum has now found acceptance within a new lower range, which opens the probability that price will rotate toward the bottom of that range. Markets often oscillate between range highs and range lows, and ETH appears to be following that behaviour.
A continuation lower toward $2,100 would mark a retest of a major macro support zone. This would also fit the pattern of a deeper corrective leg forming after multiple failed attempts to reclaim broken support. While traders may see short-term upside from oversold conditions, such moves are corrective rather than trend-changing in the current environment.
What to expect in the coming price action
A short-term bounce from $2,600 is possible, but it would likely form a lower high before the next leg down. If Ethereum continues to hold below $3,500, the probability of a move toward the $2,100 range low increases. Only a strong reclaim of resistance would challenge the bearish outlook.