
The end of the week is controlled by bears, according to CoinMarketCap.
ETH/USD
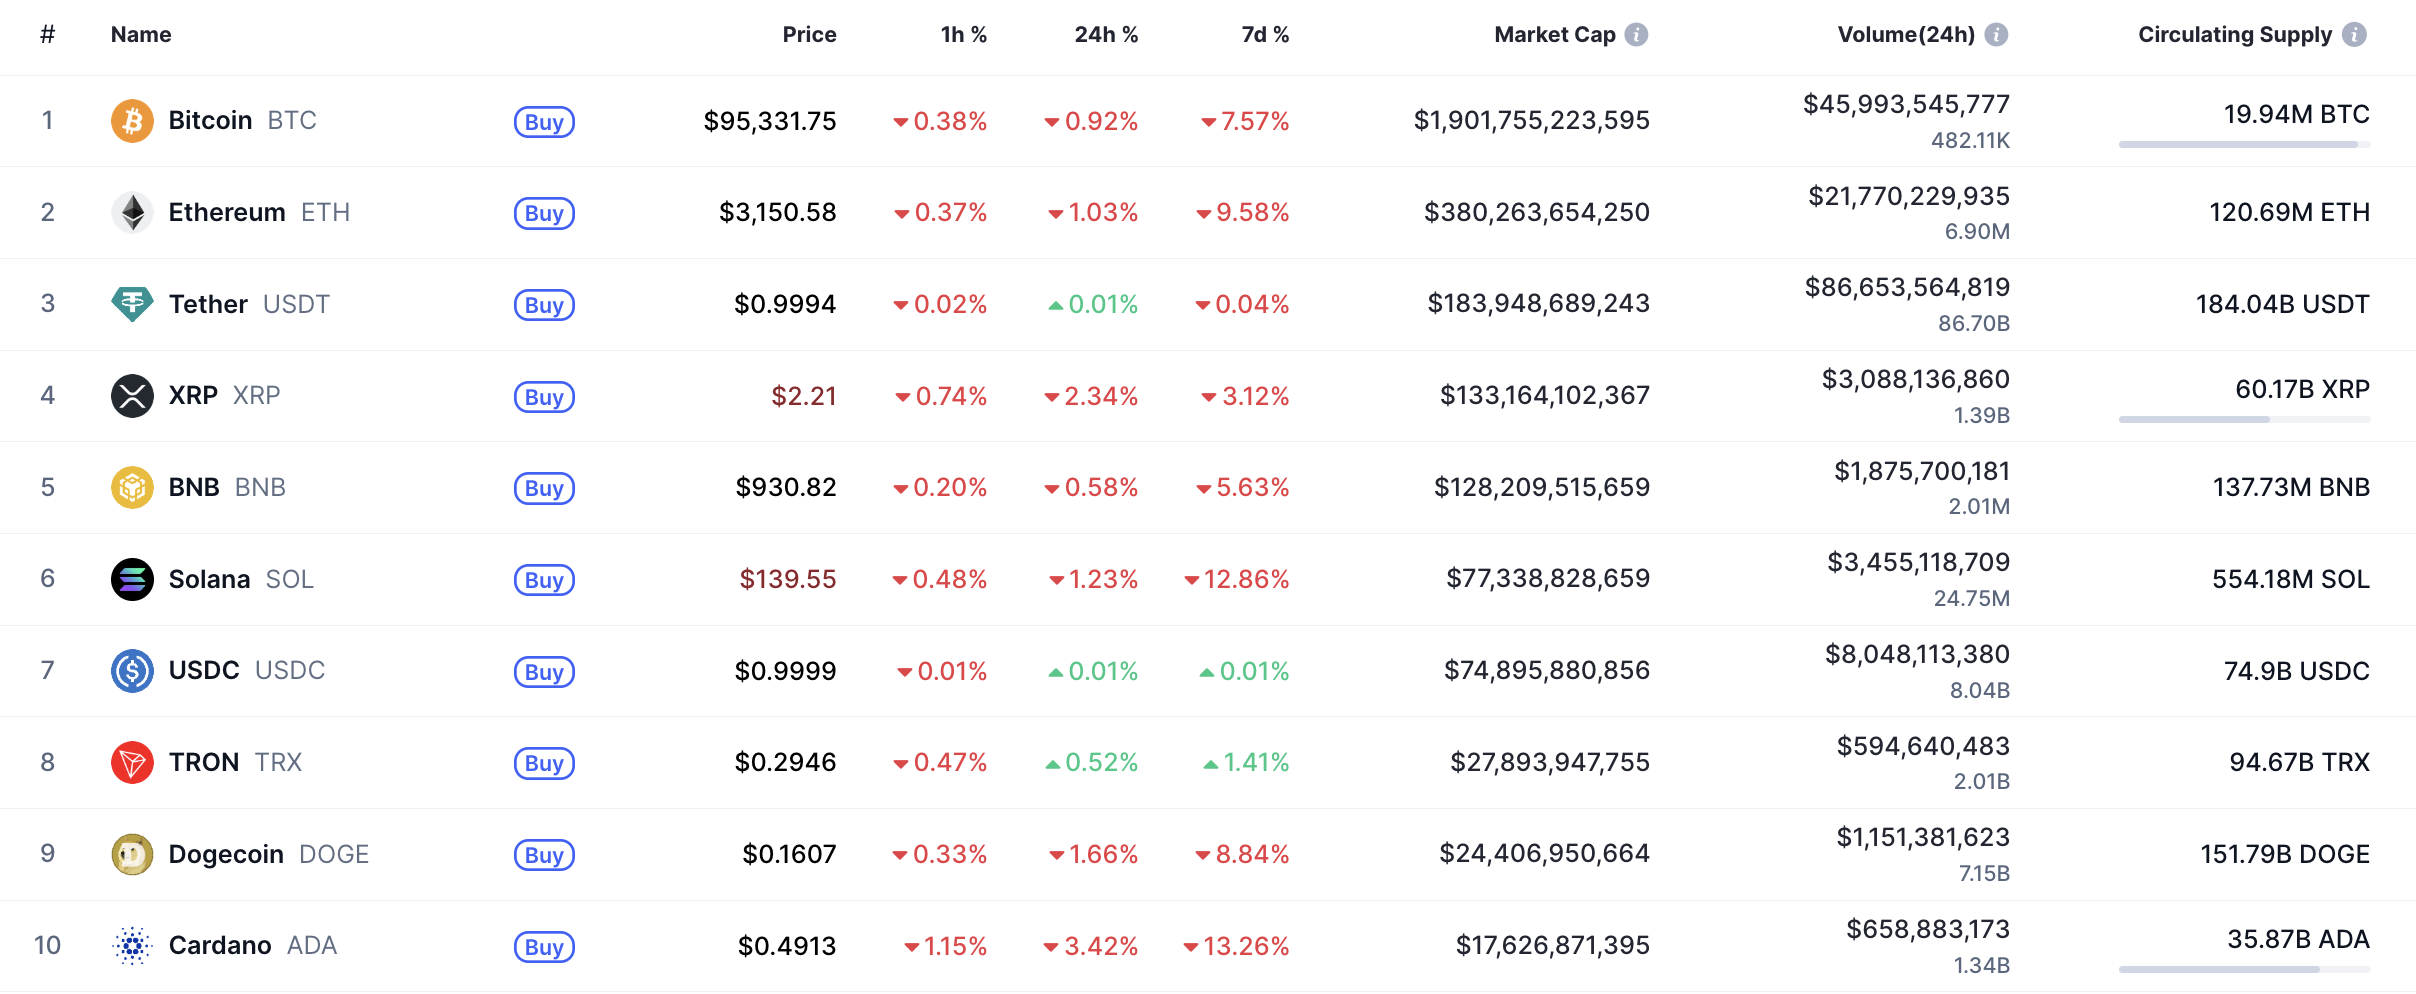
The rate of Ethereum (ETH) has declined by 1.03% over the last 24 hours.
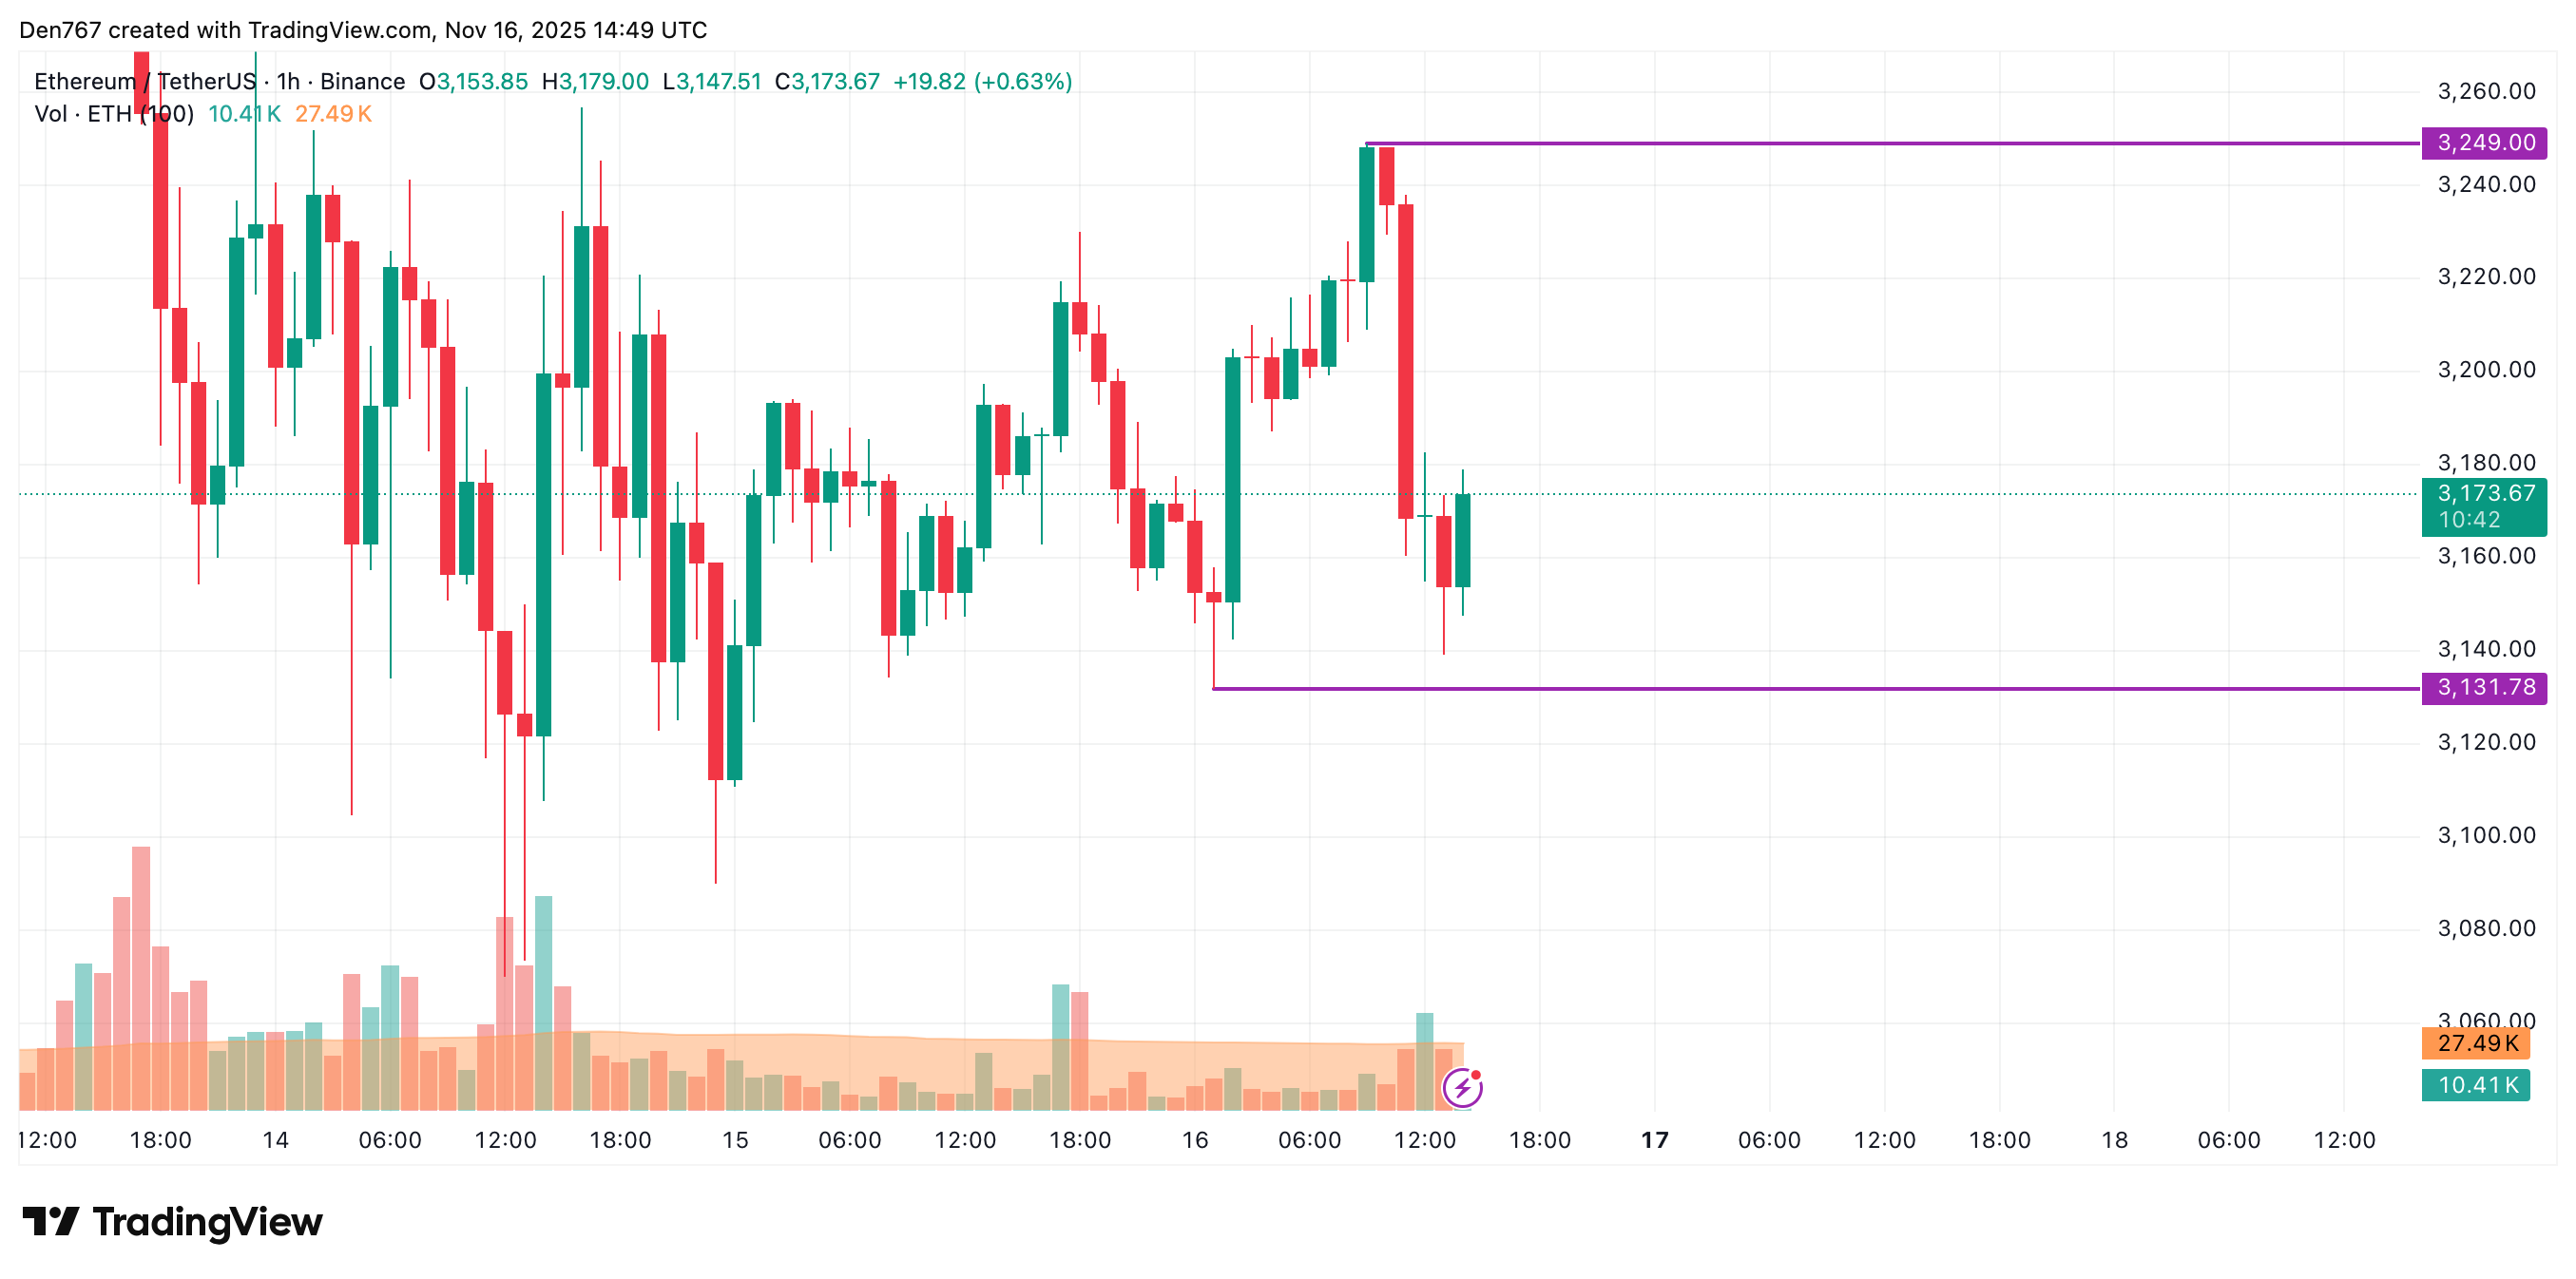
On the hourly chart, the price of ETH is closer to the support than to the resistance level. If the daily bar closes near $3,131, the decline is likely to continue to the $3,100 zone shortly.
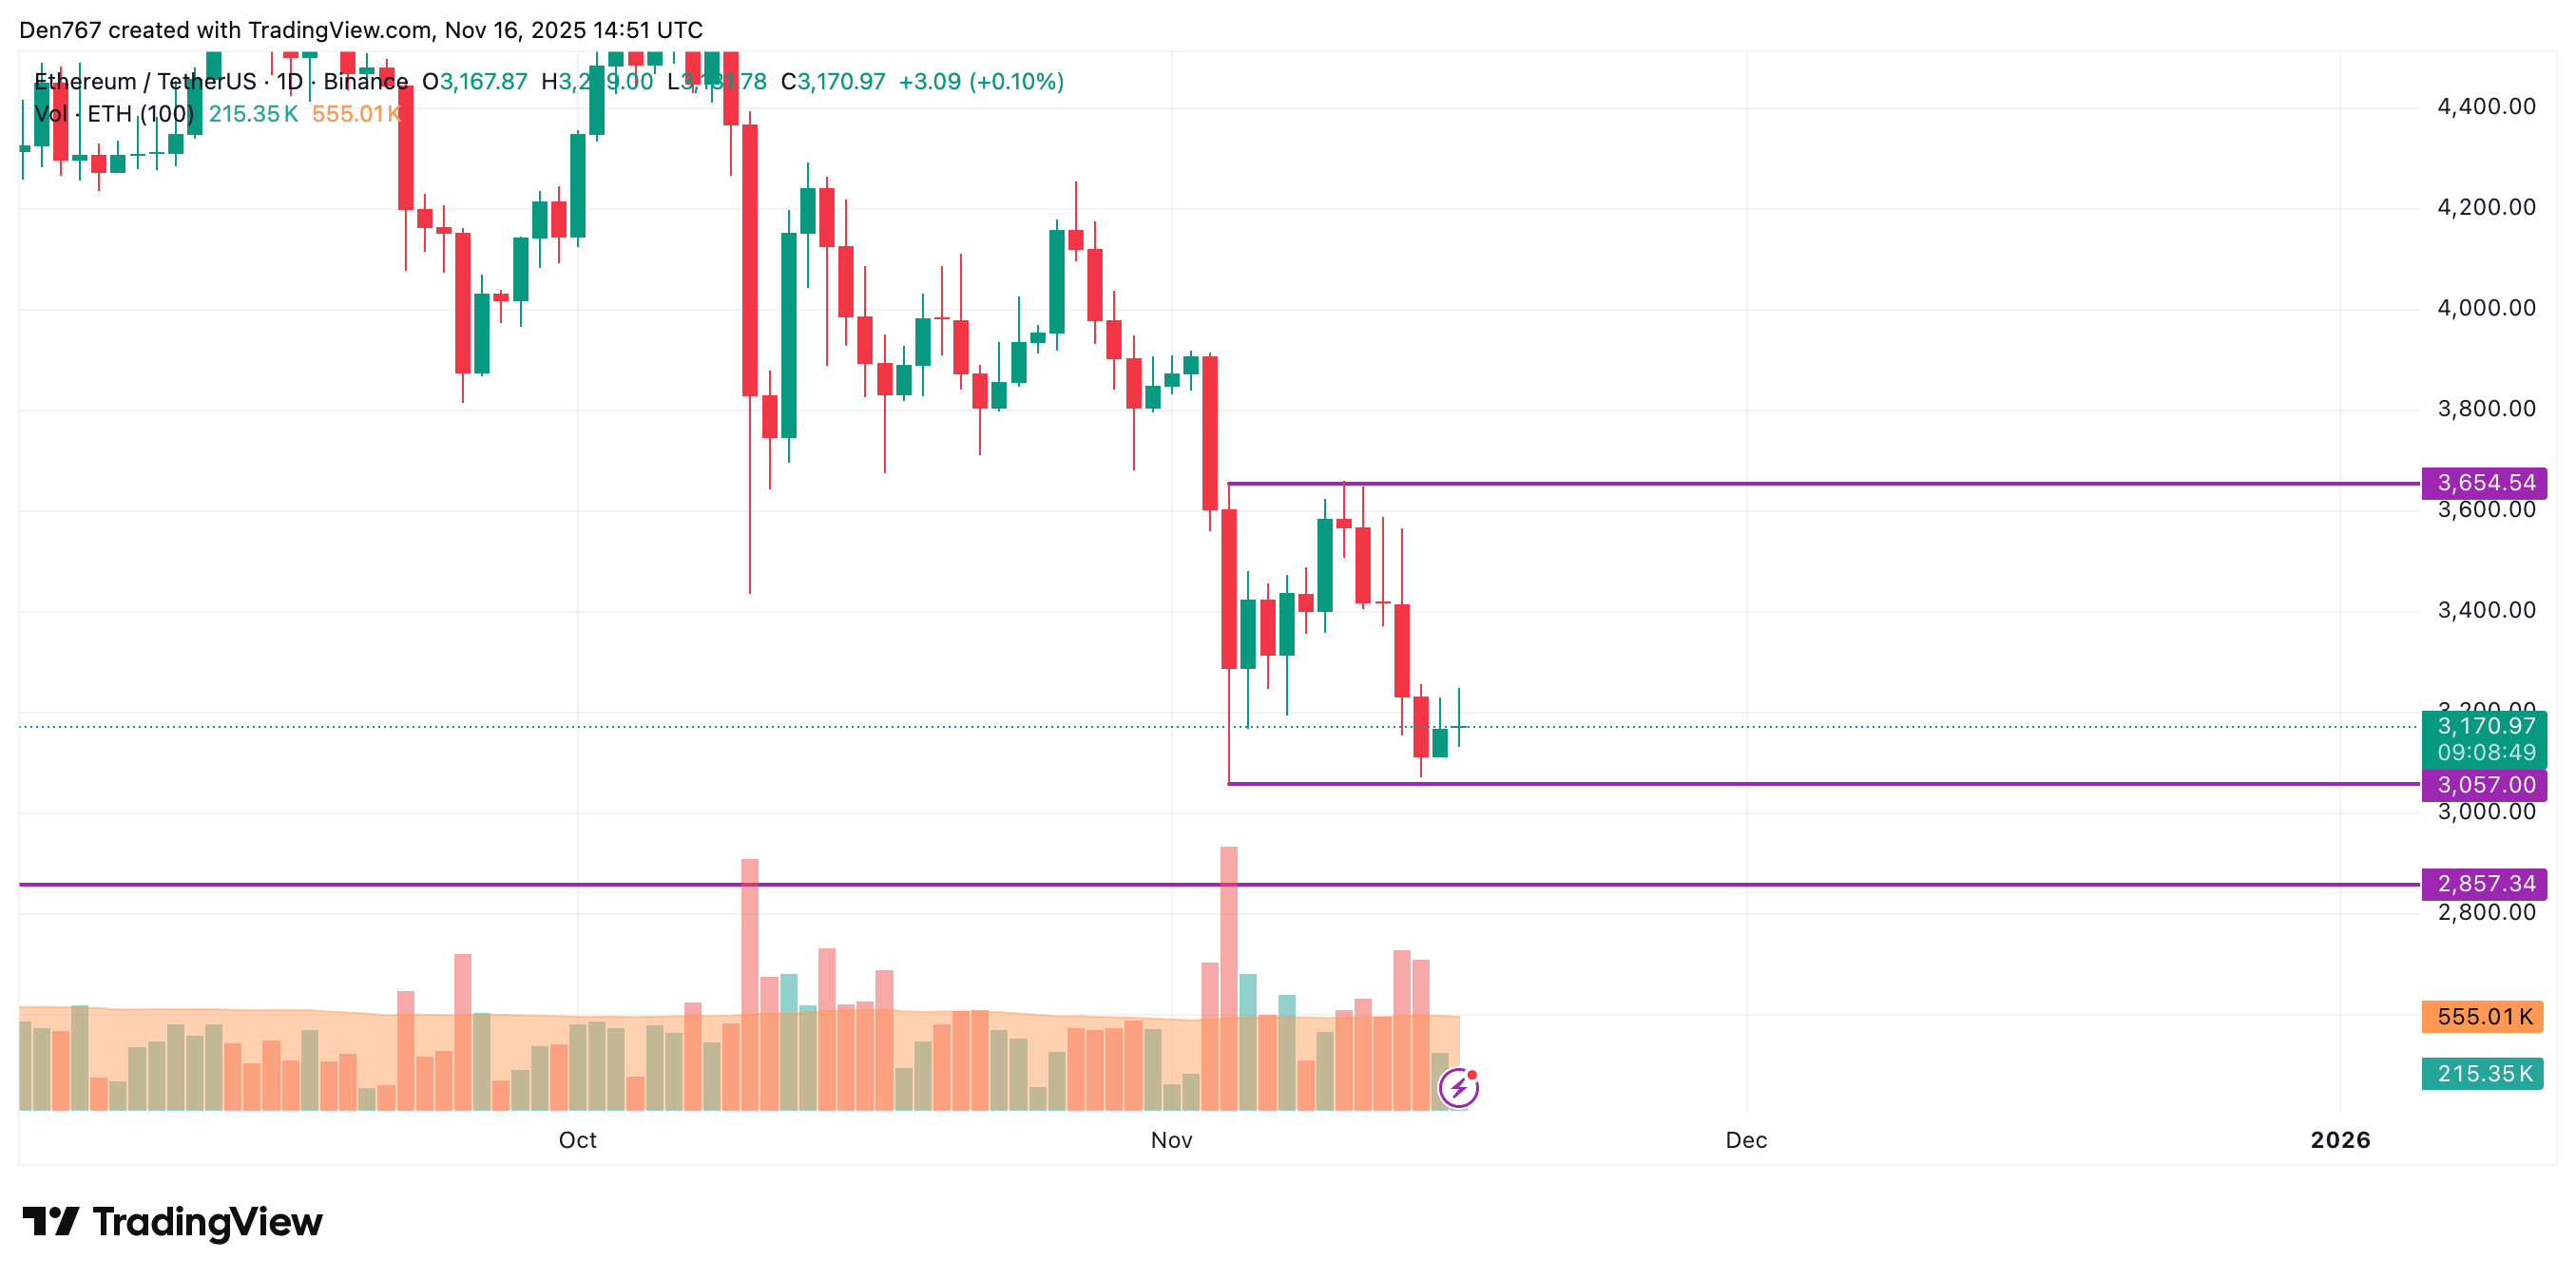
A similar picture is on the bigger time frame. If a breakout of the $3,000 area happens, the accumulated energy might be enough for a test of the $2,857 support.
Such a scenario is relevant until the end of the month.
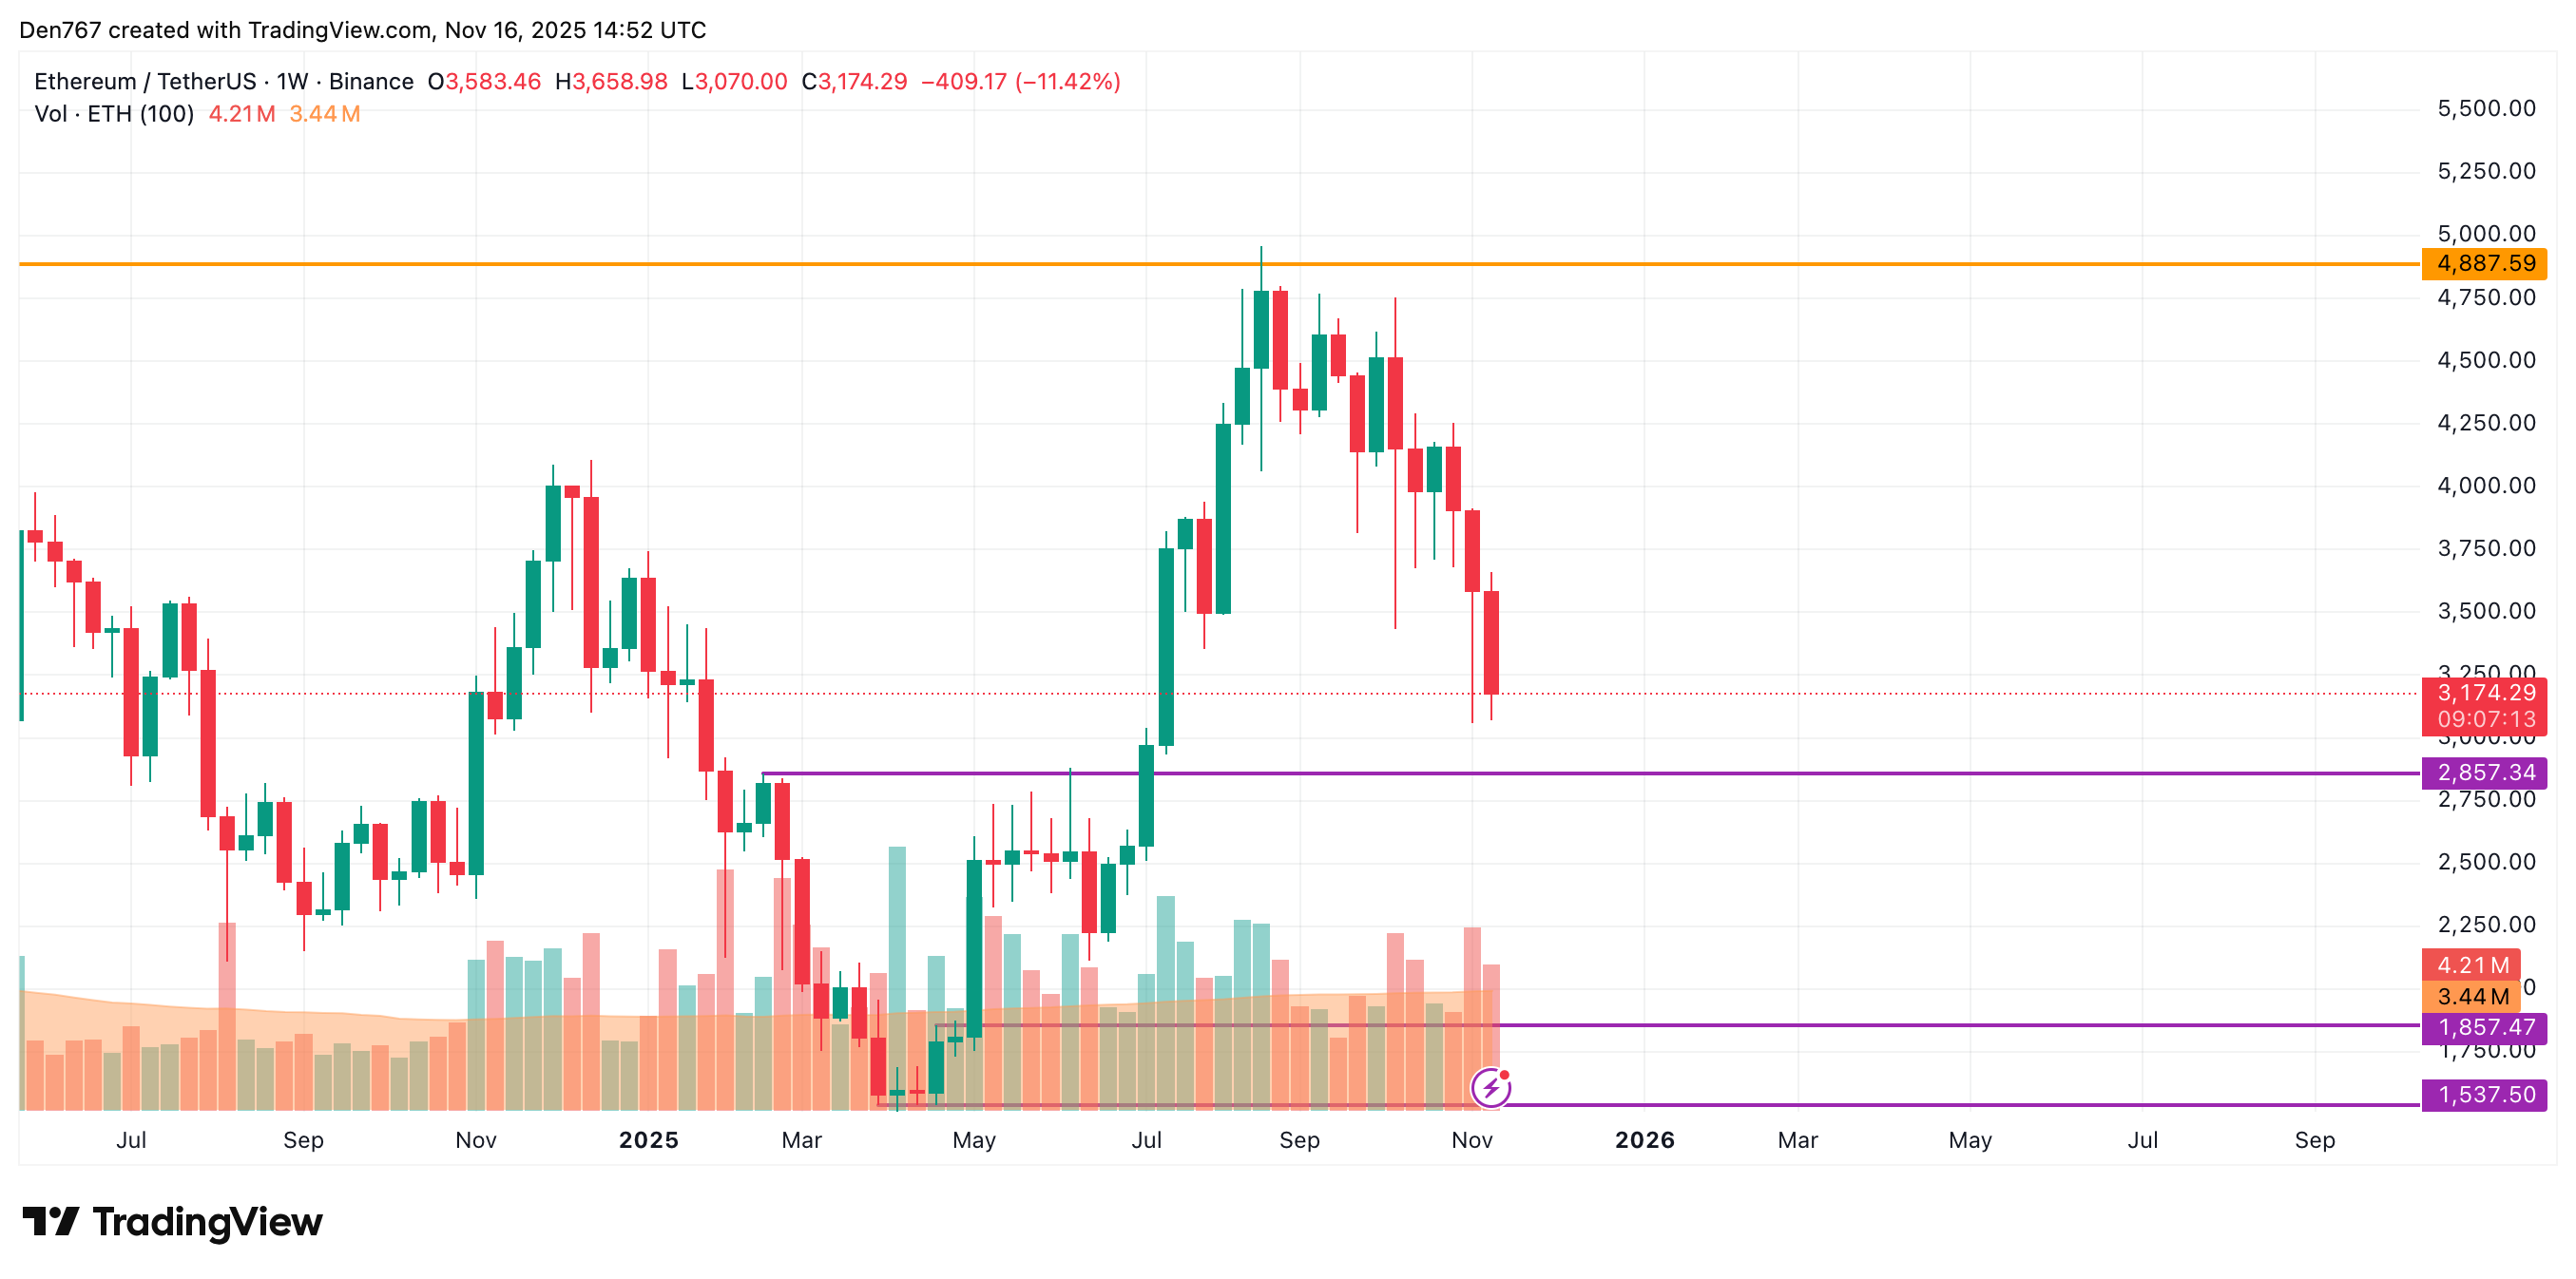
From the midterm point of view, one should focus on the weekly candle closure in terms of the $2,857 mark. If a false breakout happens, buyers may seize the initiative, which may lead to a bounce back to the $3,000-$3,200 range.
Ethereum is trading at $3,174 at press time.