
$ETH price is testing a crucial support level after carving out a bullish reversal pattern. Could a bounce from here put it back on track for a strong upward move?
- $ETH price is testing $4,100 support level after dropping from its Monday high.
- A double-bottom pattern has formed on the 4-hour chart.
- Technical indicators have signaled early signs of reversal.
After rallying 10% to a weekly high of $4,232 on Monday, Ethereum ($ETH) has pulled back as profit-taking kicked in, slipping close to psychological support at $4,100, a level it needs to hold to prevent deeper losses.
Ethereum’s slump follows after it shaped a double-bottom pattern on the 4-hour chart, a setup that often leads to a reversal to an uptrend. In Ethereum’s case, both lows of the pattern formed near the $3,713 level, with the neckline sitting right around $4,100, which now acts as a key resistance zone.
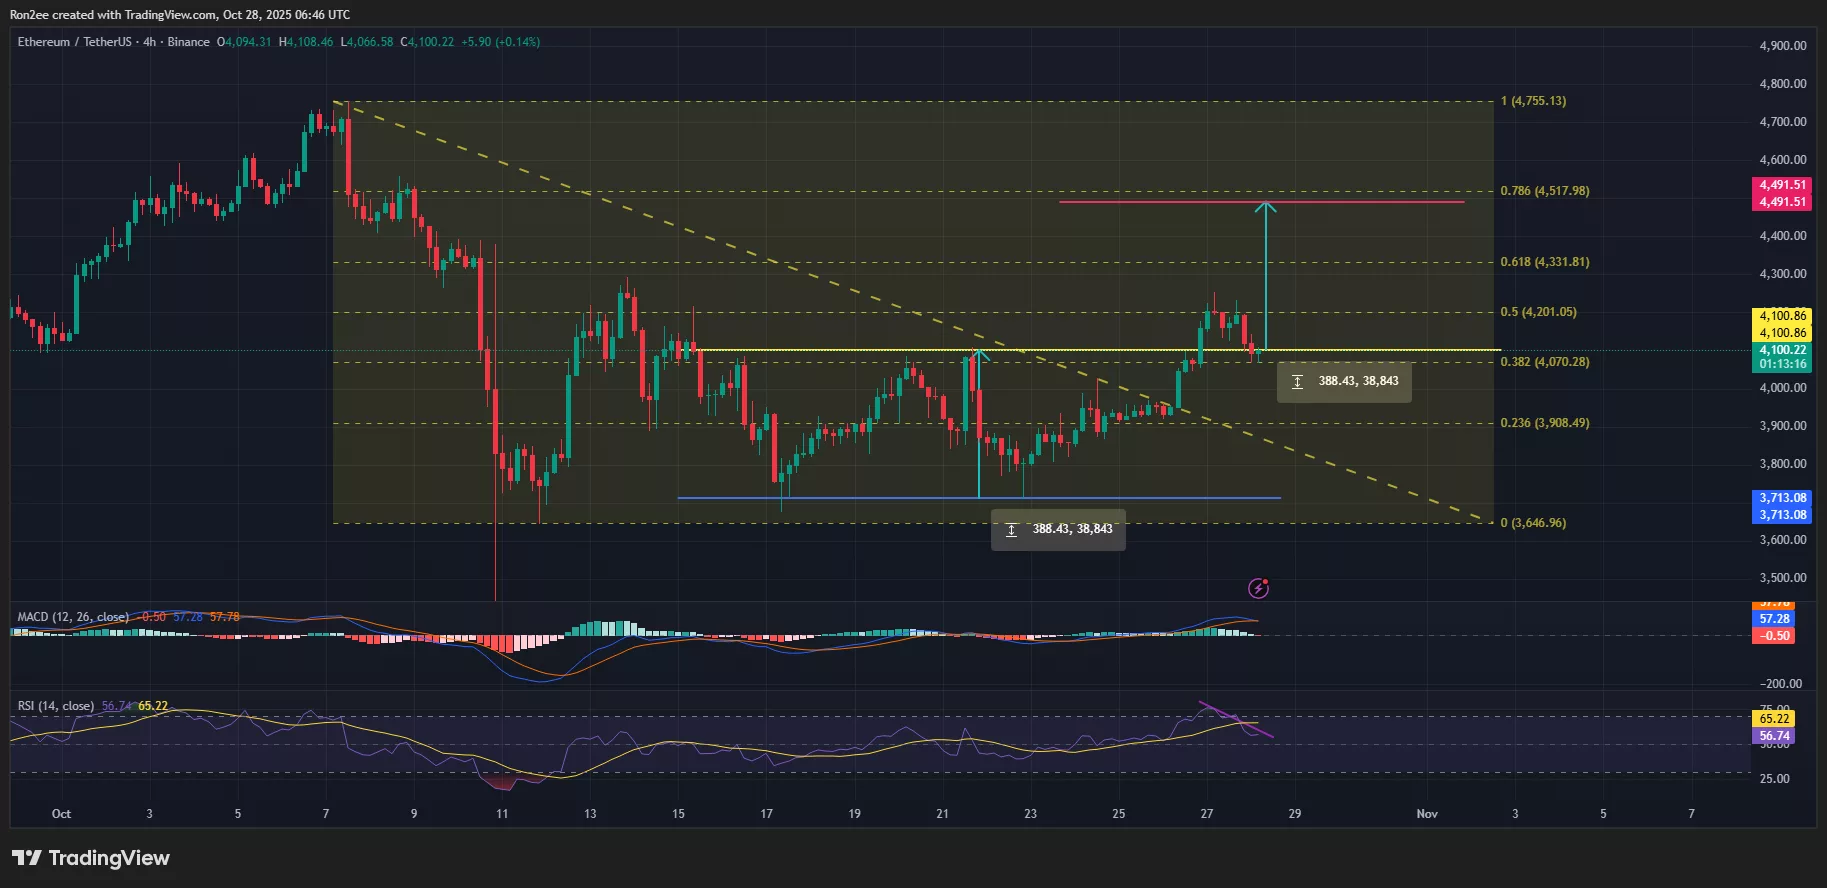 $ETH price has formed a bullish reversal pattern on the 4-hour chart.">
A breakout from this kind of structure can lead to a sustained trend reversal for days. For Ethereum, a confirmed move above the neckline opens the door for a rally toward $4,491, up 10% from current levels. The target is calculated by adding the depth of the double bottom formed to the breakout point.
$ETH technicals yet to flip bullish
However, some caution is warranted with momentum indicators sending mixed signals. The MACD line appears to be closing in on a bearish crossover with the signal line, while the RSI has formed a bearish divergence. Both are signs that upside momentum may be fading in the short term.
For now, $4,100 is acting as the immediate resistance zone, while support on the downside lies near $4,000, a psychological level Ethereum needs to hold if it wants to stay on its upward path.
According to the 24-hour liquidation heatmap from CoinGlass, a notable cluster of short liquidations is visible between $4,100 and $4,200, aligning with the neckline of the double-bottom pattern and the upper boundary of the falling wedge identified earlier.
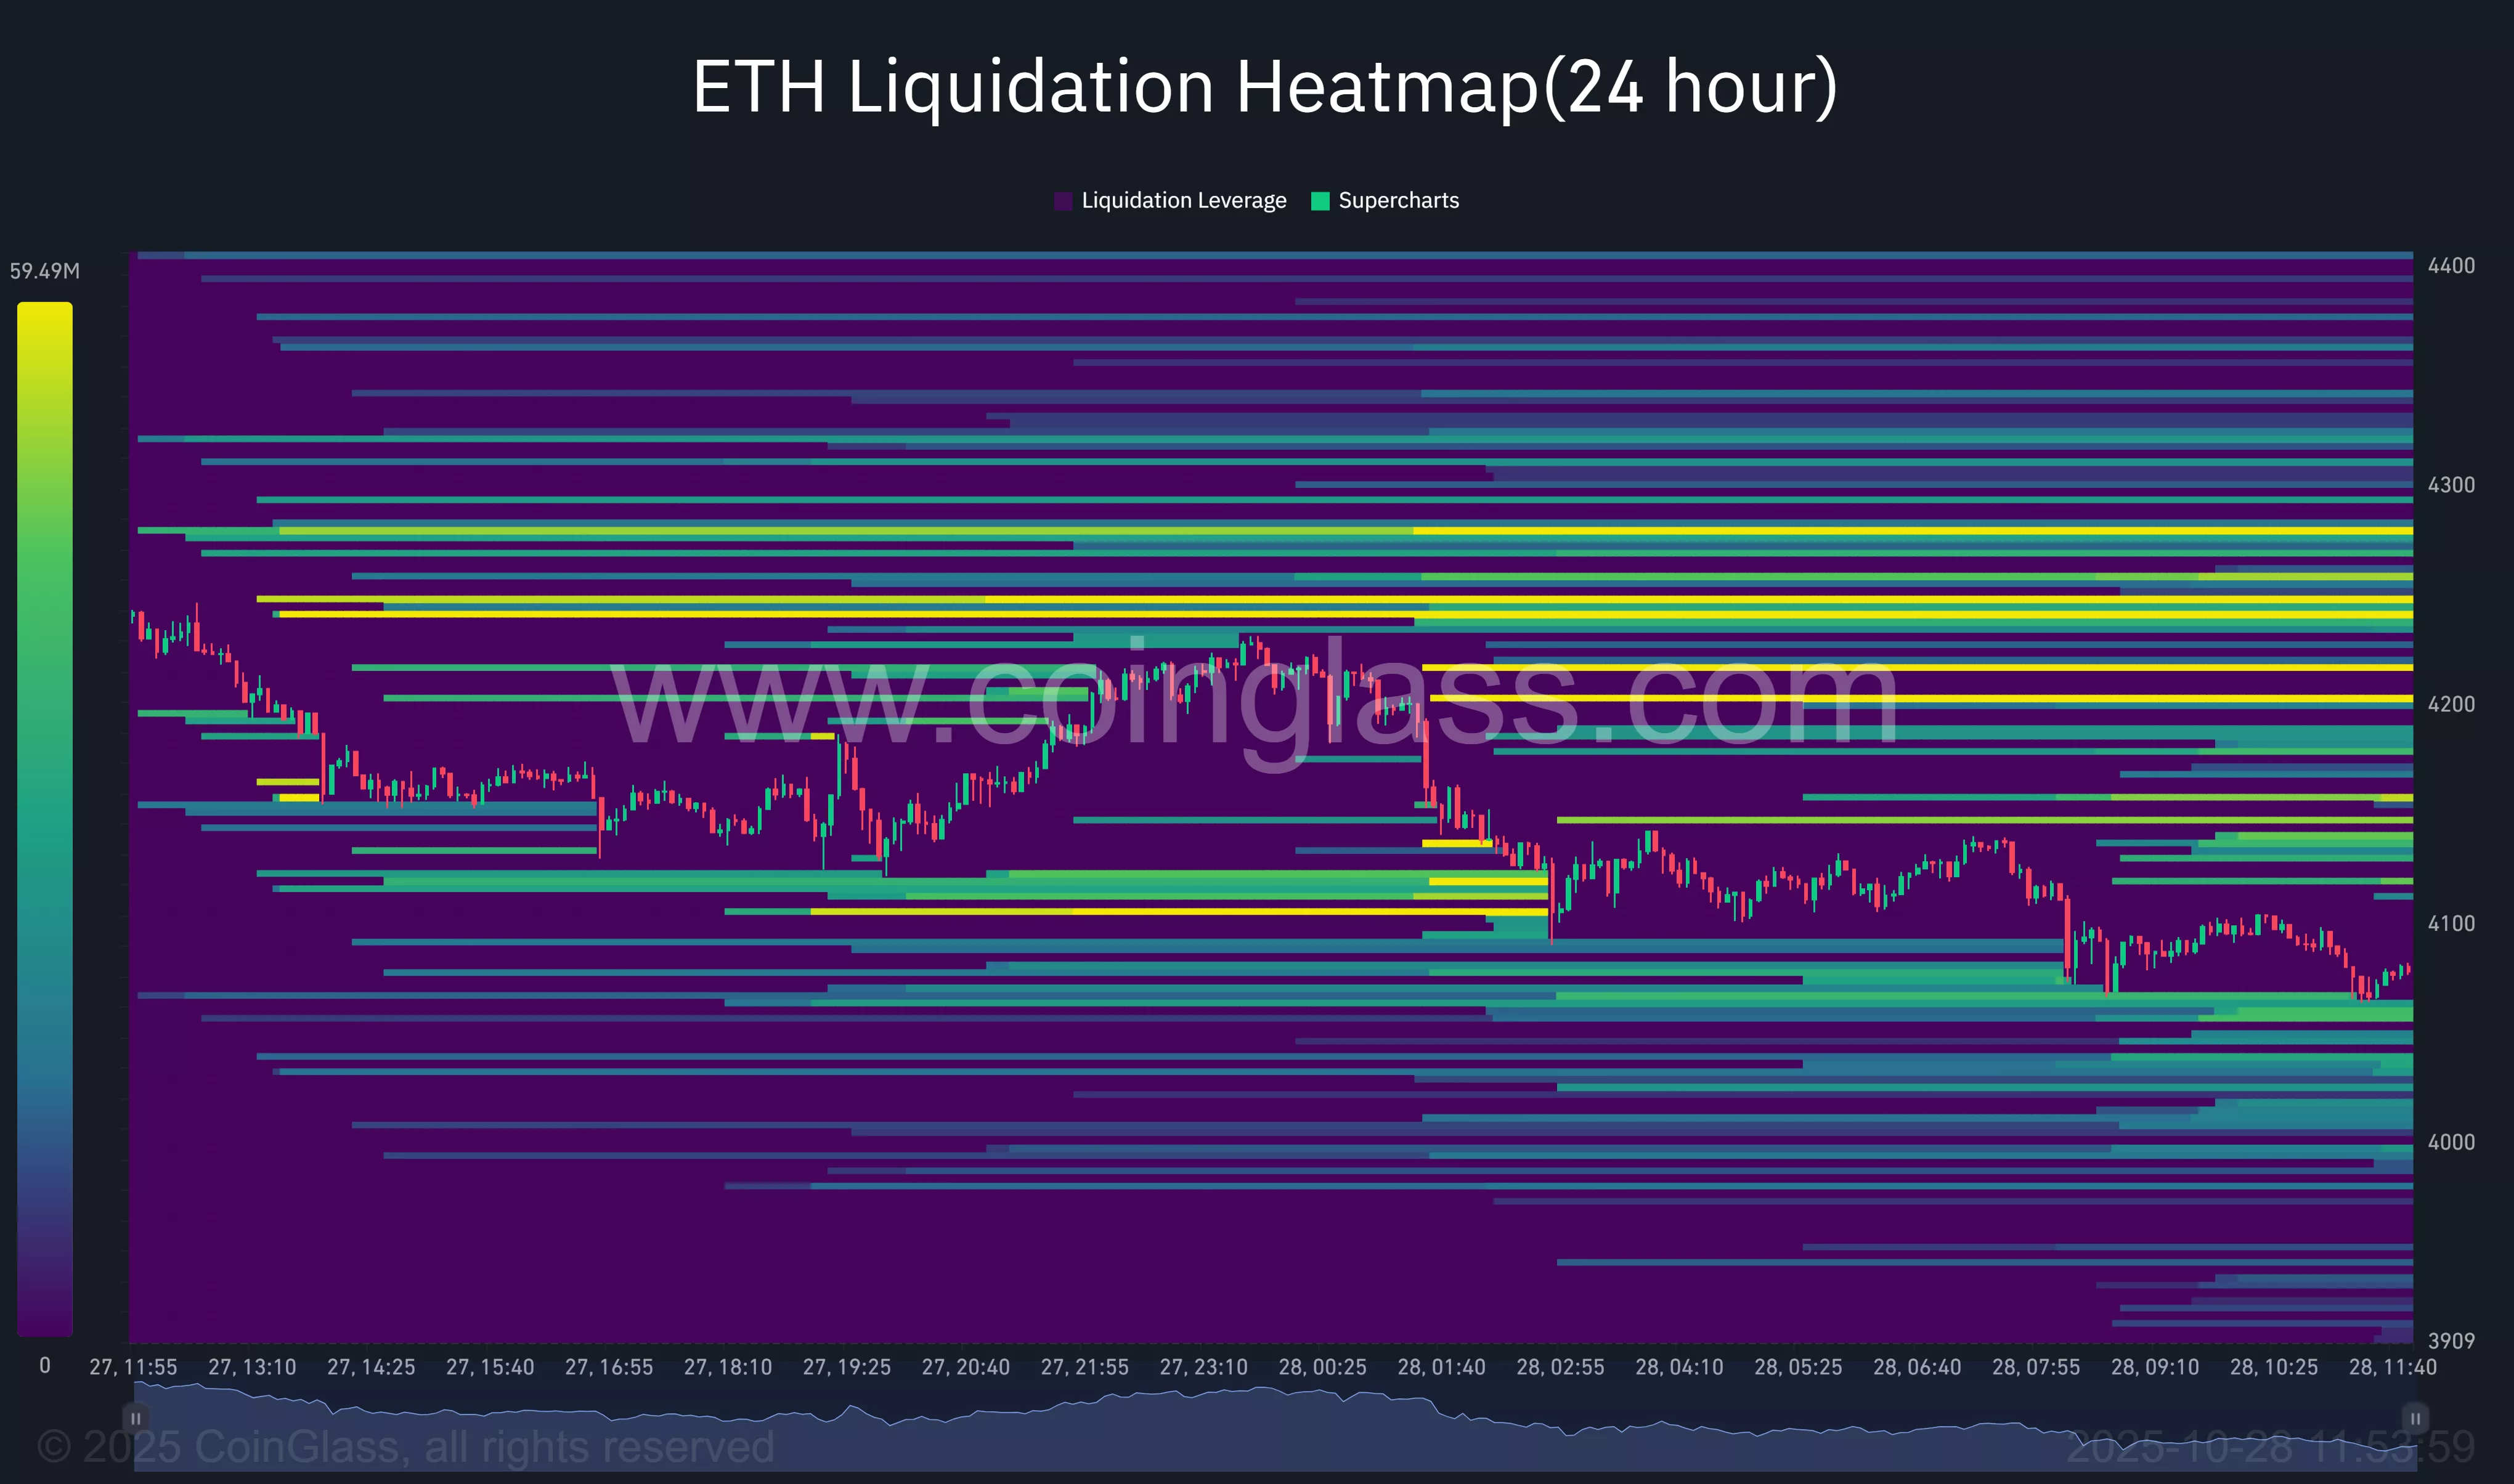 $ETH liquidation heatmap shows squeeze risk above $4,100, with thin support below $3,900.">
A clean breakout above this band could ignite a short squeeze, forcing liquidations of overleveraged positions and accelerating upward price action. With so much liquidity stacked in this zone, bulls could find the momentum needed to push $ETH toward the $4,400–$4,500 target range.
On the downside, the heatmap shows considerable liquidation interest between $4,000 and $3,900, suggesting that this area could act as a strong demand zone in the near term.
If Ethereum dips into this region, buyers may step in aggressively to defend key support. However, if $ETH breaks below $3,900, the chart begins to thin out, indicating weaker liquidity and limited buy-side interest, which could expose the token to heightened volatility and steeper losses, possibly dragging it toward the $3,700–$3,650 region.
Disclosure: This article does not represent investment advice. The content and materials featured on this page are for educational purposes only.