Lately, the U.S market is bracing for what it calls the “ETF Month” in October, which will see the final decision for at least 16 crypto ETFs backed by altcoins like Solana (SOL), Ripple (XRP), and Dogecoin (DOGE). Meanwhile in Asia, Thailand regulators are preparing to draft regulations to facilitate the expansion of the crypto ETF market to include more altcoins beyond Bitcoin.
As Ethereum ($ETH) is the second-largest crypto and a foundational layer for DeFi and tokenization, the token is often seen as a prime beneficiary of institutional products that go beyond just the staple Bitcoin. According to data from SoSoValue, Ethereum spot ETFs saw $80.79 million in net inflows, also extending their streak to three consecutive days.
In addition, whale accumulation has been reported across Ethereum wallets, which aligns with the sudden spike in its price. According to data from Coinglass, daily spot trading volume for $ETH rose to $7.17 billion. Meanwhile, futures trading volume has reached up to $97.3 billion. Open interest, or money locked into $ETH futures, has gone up by nearly 2% to $59 billion.
On Oct. 2, Ethereum price soared by 6.7%, marking a comeback after it mostly held its ground above the $4,000 zone for the past few days. Its market cap has also seen an increase of 6.3%, amounting to $531 billion.
You might also like: Ethereum price prediction: Can $ETH break $4,600 and target $5K?
Ethereum price analysis
According to data from TradingView, Ethereum has pushed strongly above $4,400, printing a clear bullish breakout. The move coincided with a surge in momentum, visible in the steep rise of the price candles and the separation from the 30-period moving average, which sits lower at around $4,396.
The Relative Strength Index is currently hovering around 72, which places Ethereum in the overbought territory. This indicates that while bullish sentiment remains dominant, $ETH could be at risk of a short-term pullback or consolidation as traders take profit.
Historically, readings above 70 often come before a pause in upward momentum. However, strong breakouts could also keep the RSI elevated for an extended period.
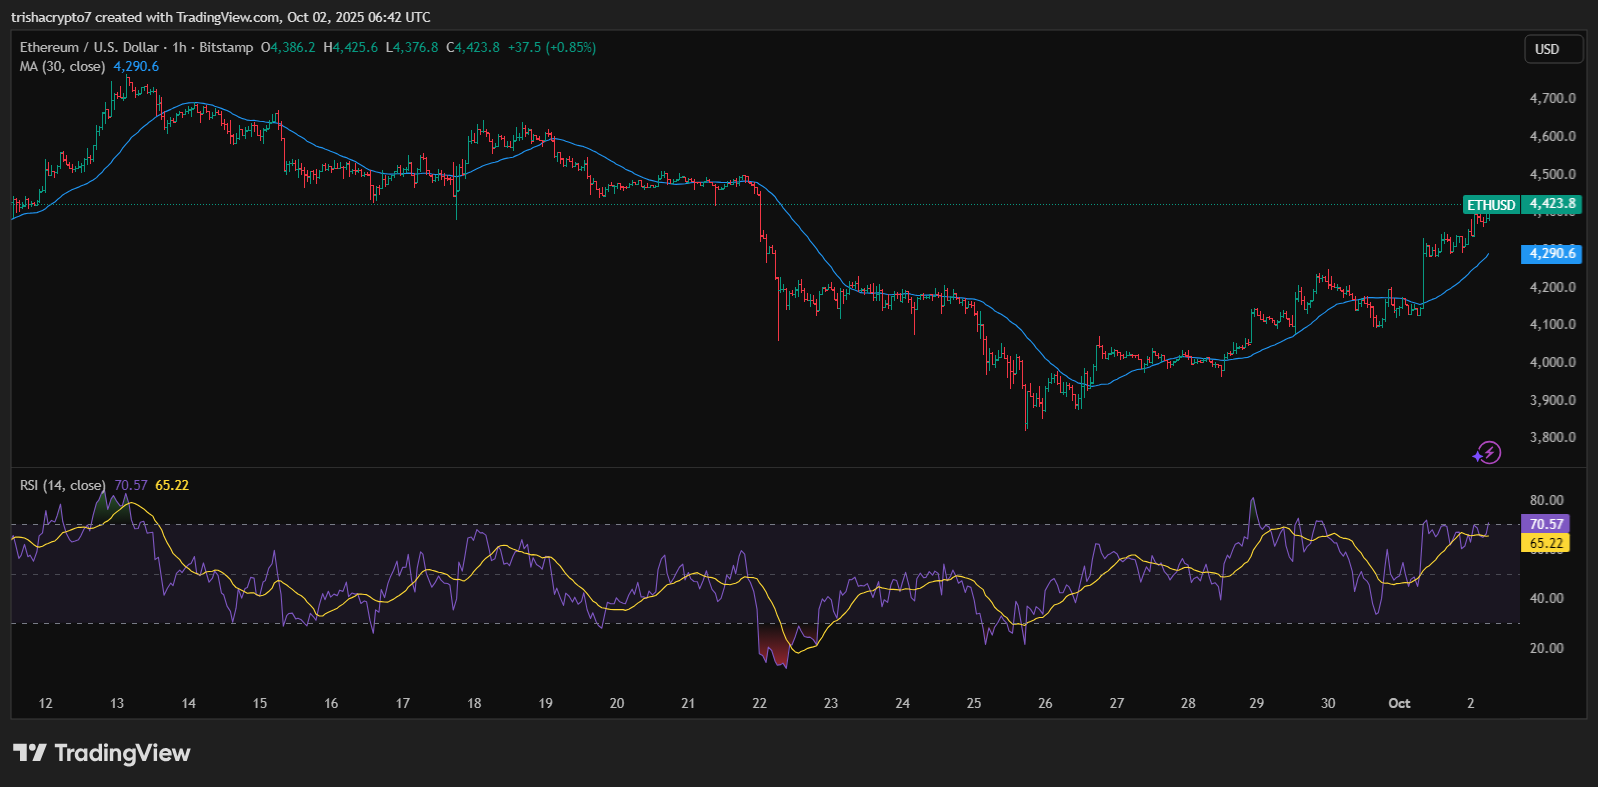
Ethereum price has risen above the 30-day moving average, indicating a breakout | Source: TradingView
Despite the risk of a short-term pullback, the breakout above $4,400 was rapid and sharp; with only a little resistance slowing $ETH down. This rapid price surge suggests a wave of buy orders, possibly from whales or momentum traders, that pushed Ethereum higher in such a short span of time.
The next resistance zone for the token will be near the $4,450 to $4,500 range, a psychological round number that may attract sellers. If bulls maintain control, $ETH has a chance of rising toward higher resistance zones.
On the other hand, immediate support lies around the breakout level of $4,400. If Ethereum dips below $4,400, the next cushion would be near the 30-day MA at $4,396, followed by stronger support in the $4,350 to $4,360 range. If it fails to hold above these levels, Ethereum price could trigger a deeper correction. Therefore, as long as $ETH stays above $4,400, the breakout remains intact.
You might also like: Crypto market update: Ethereum and major altcoins lag after $1.5b wipeout

 crypto.news