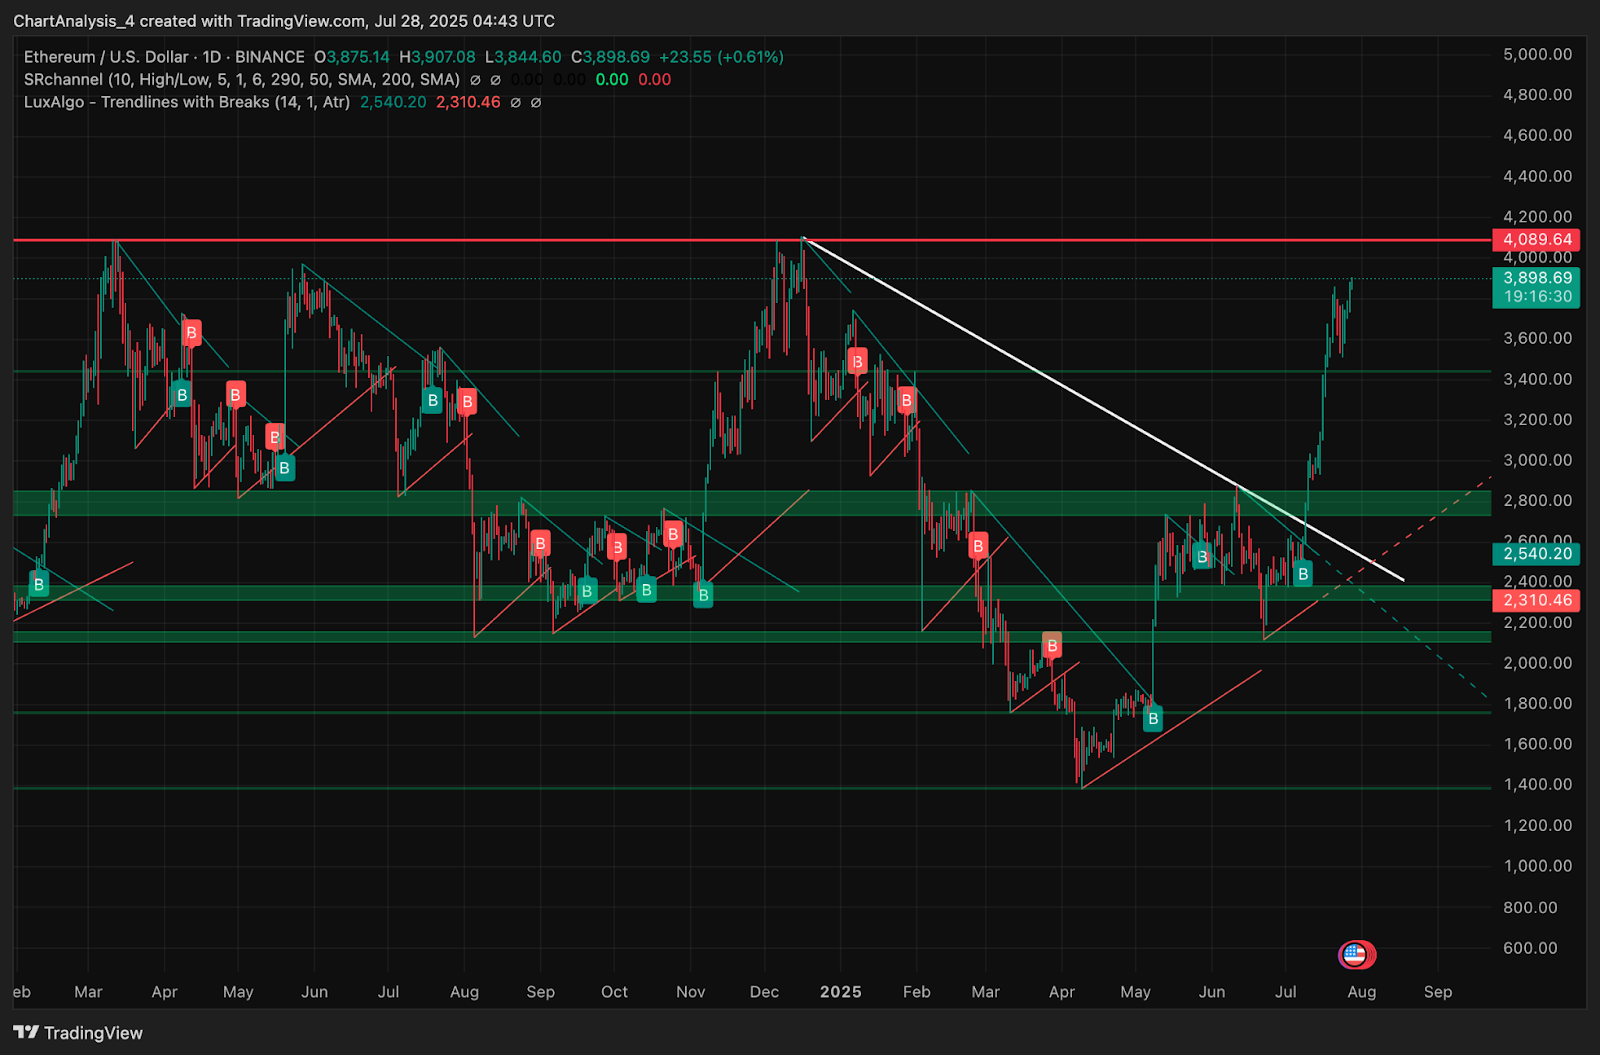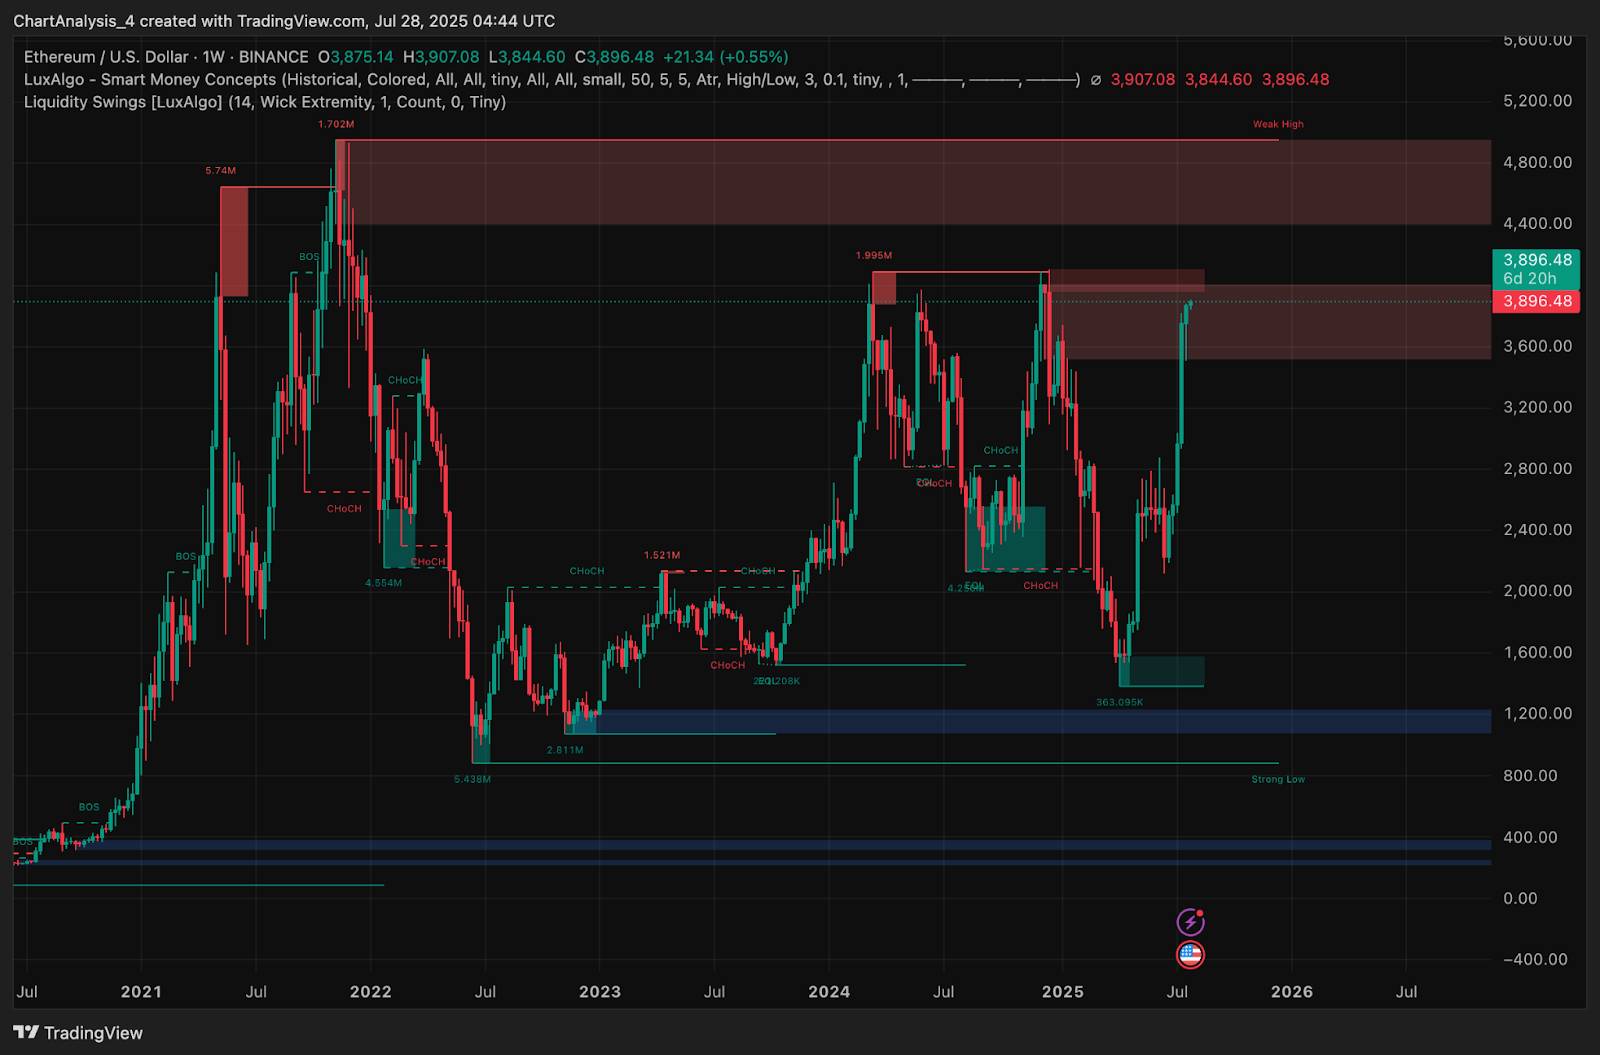
$ETH price dynamics (Source: TradingView)
On the weekly timeframe, $ETH is pressing into a red Smart Money liquidity zone between $3,890 and $4,200. This region acted as distribution territory during the April and May 2024 peaks and represents the final resistance before a potential run toward $4,500 and $4,800. A close above $4,089 would mark a macro BOS and open up a fresh leg higher.
Why Is The Ethereum Price Going Up Today?
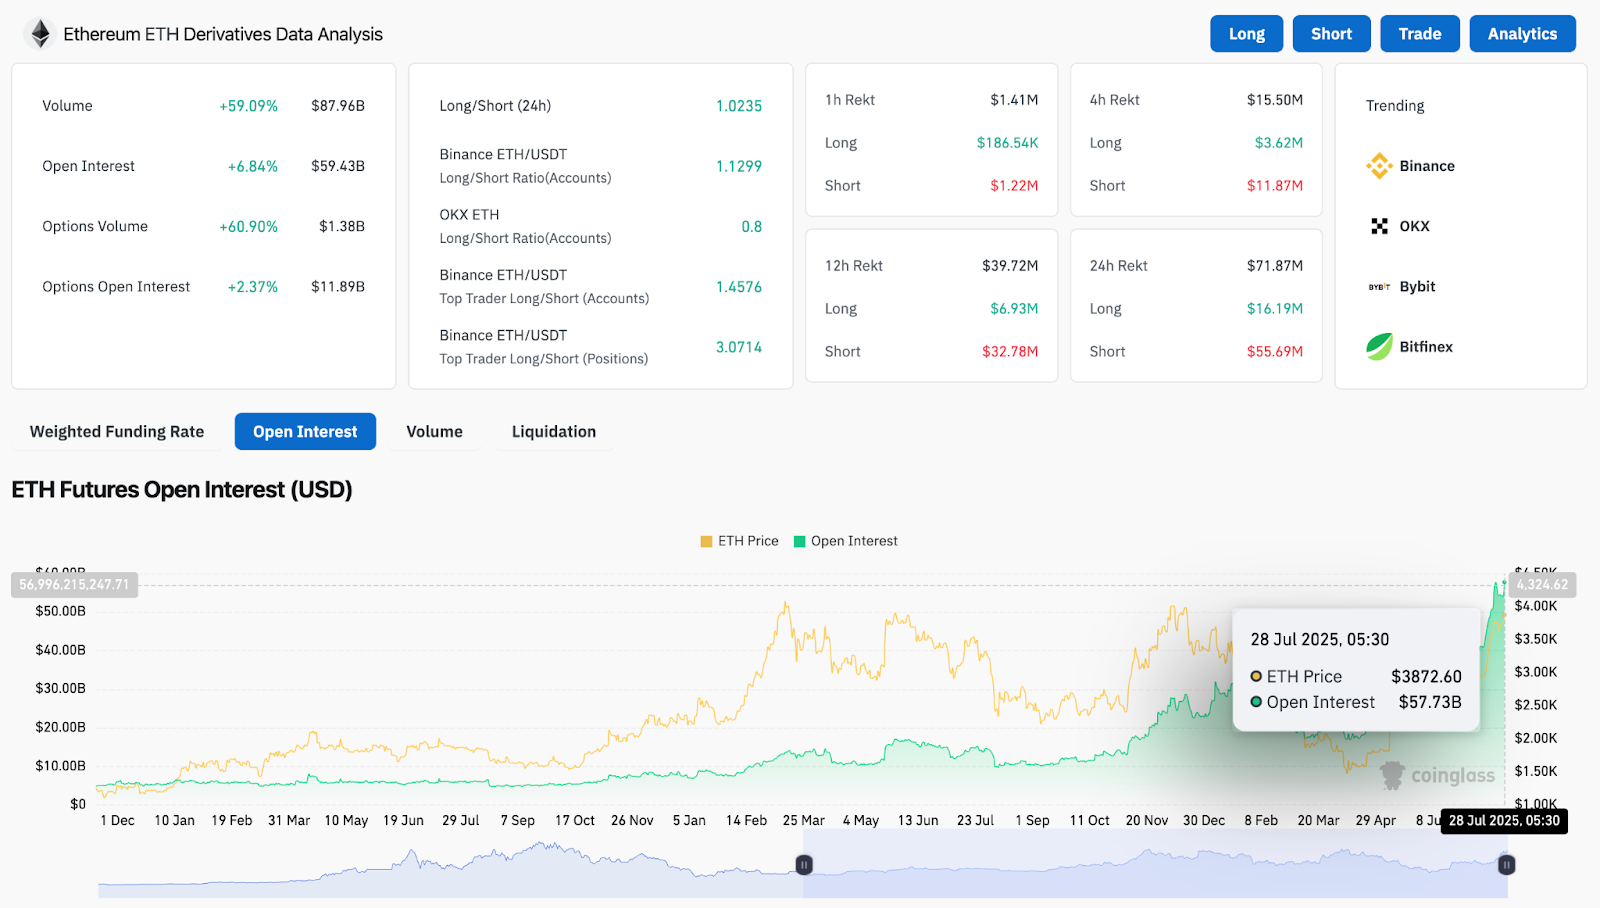
$ETH Derivative Analysis (Source: Coinglass)
Why Ethereum price going up today is tied to a combination of technical breakout strength and heavy derivatives flow. Coinglass data showed a 59.1 percent surge in $ETH trading volume over the past 24 hours, with open interest climbing 6.84 percent to $59.43 billion. Binance’s top trader long to short ratio reached 3.07, showing significant institutional positioning.
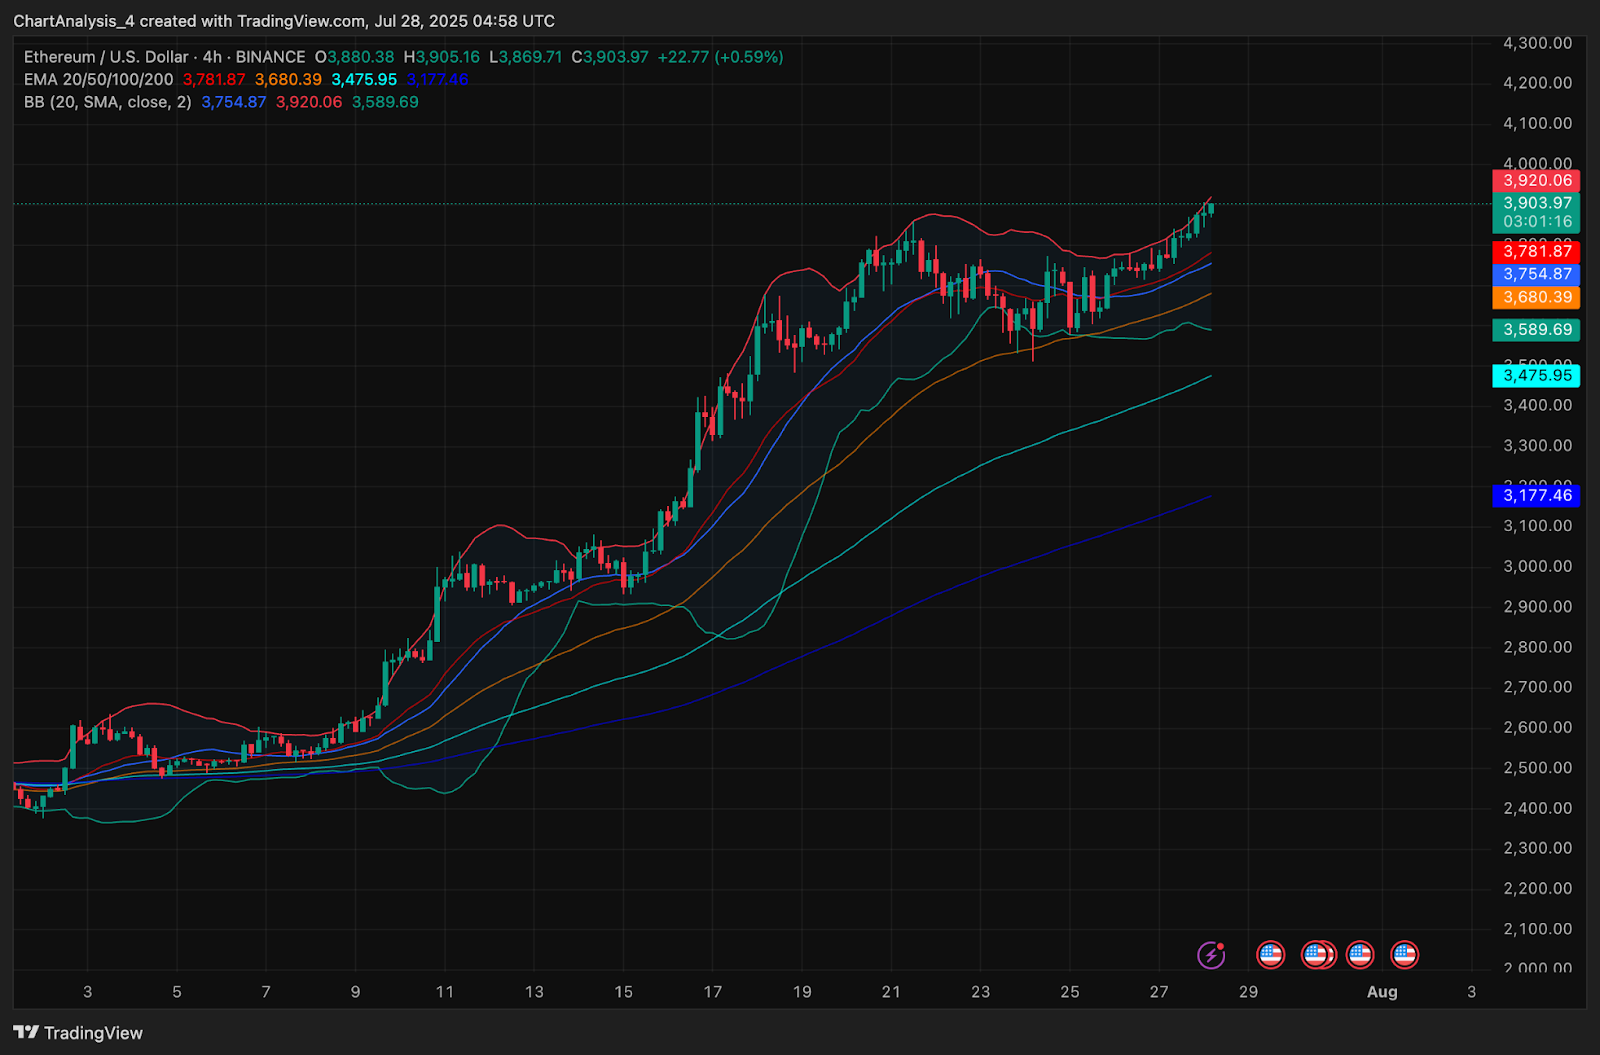
$ETH price dynamics (Source: TradingView)
The 4-hour chart reflected strong trend momentum, with candles climbing along the upper Bollinger Band near $3,920. Price remained firmly above the EMA 20, 50, 100, and 200 cluster, which now acts as a multi-layered support base between $3,475 and $3,781.
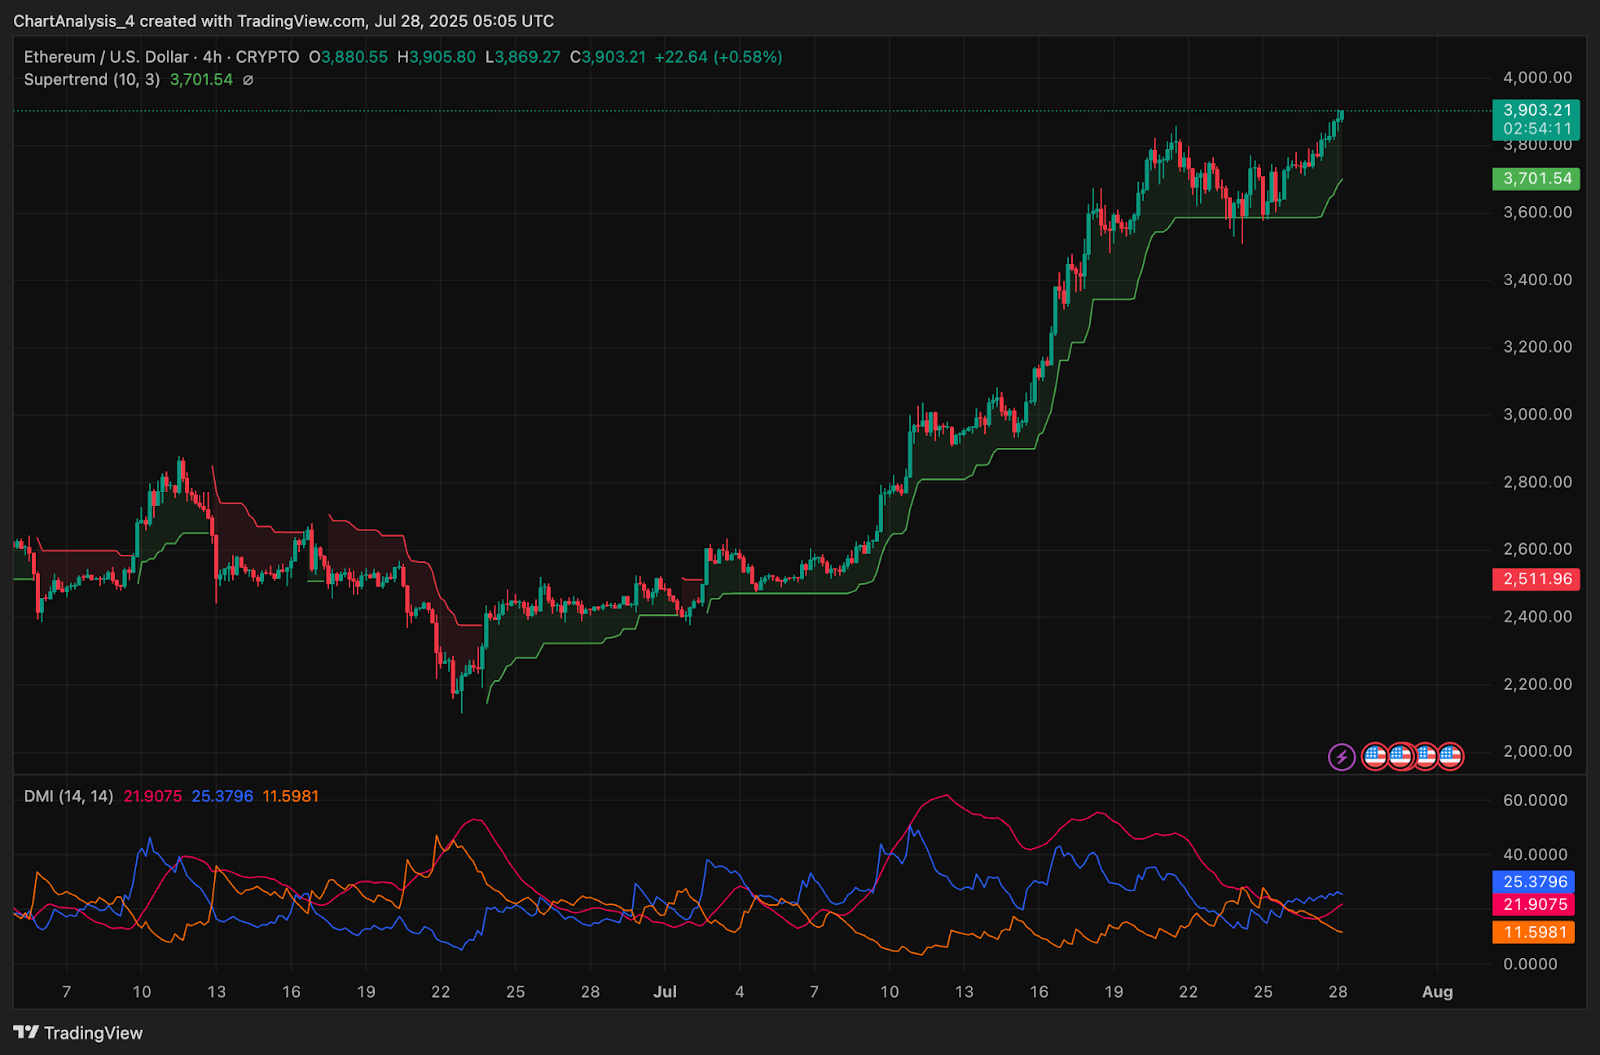
$ETH price dynamics (Source: TradingView)
The Supertrend flipped bullish on July 9 and continued to trail price action tightly, currently sitting at $3,701. Directional Movement Index showed the +DI at 25.3 leading over -DI at 11.5, while ADX was rising. This confirmed the growing trend strength.
Channel Structure and RSI Signal Healthy Trend Extension
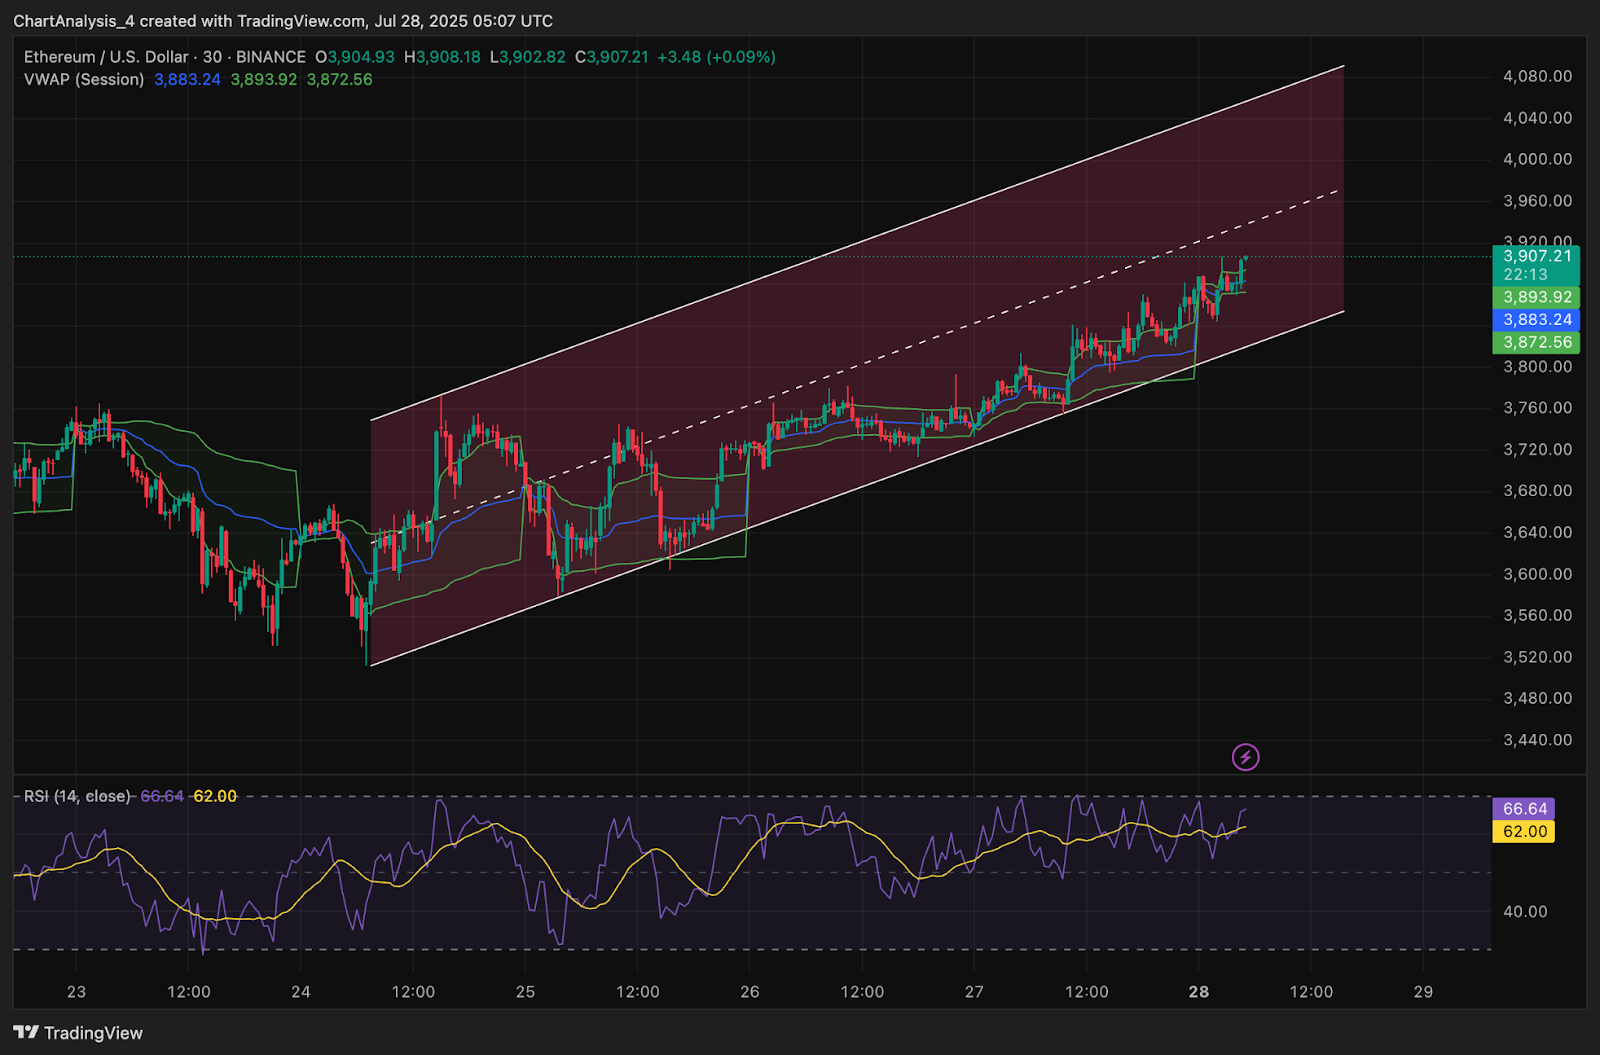
$ETH price dynamics (Source: TradingView)
On the 30-minute chart, $ETH respected an ascending channel that had guided price since July 24. Price was riding the median line, with VWAP support holding around $3,883 and RSI cooling from 66 to 62, avoiding overbought territory. This gradual slope indicated controlled, low-volatility trend continuation rather than euphoric exhaustion.
Bollinger Bands expanded again on the 4-hour chart, and price was pressing against the upper band at $3,920. If this band breaks, volatility expansion could drive $ETH toward $4,050. However, traders needed to remain cautious of the long-term red zone between $4,000 and $4,200, which previously triggered a cascade of sell-offs.
$ETH Price Prediction: Short-Term Outlook (24H)
Ethereum price remained structurally bullish, but momentum could temporarily slow as price tested the $3,920 to $4,089 liquidity ceiling. A clean breakout above $4,089 would have signaled continuation toward $4,300 and $4,500. These levels currently showed no immediate supply zones.
If $ETH failed to break above $4,000 with volume, a healthy pullback toward $3,754 (lower Bollinger Band) and $3,680 (EMA50) was likely. These levels aligned with the prior breakout zone and offered re-entry potential for bulls.
As long as $ETH held above the $3,680 to $3,754 support band, the uptrend remained intact. Volume and VWAP needed to be monitored closely to assess whether accumulation was still in play or if profit-taking began near the $4,000 mark.
Ethereum Price Forecast Table: July 28, 2025
Disclaimer: The information presented in this article is for informational and educational purposes only. The article does not constitute financial advice or advice of any kind. Coin Edition is not responsible for any losses incurred as a result of the utilization of content, products, or services mentioned. Readers are advised to exercise caution before taking any action related to the company.

 coinedition.com