For August 1, 2025, the model estimates Ethereum could trade between $4,752.48 and $6,901.15, a range corresponding to the “HODL!” zone. However, based on Ethereum’s current position and price momentum, the asset is likely to remain in the “Steady…” zone over the next few days.
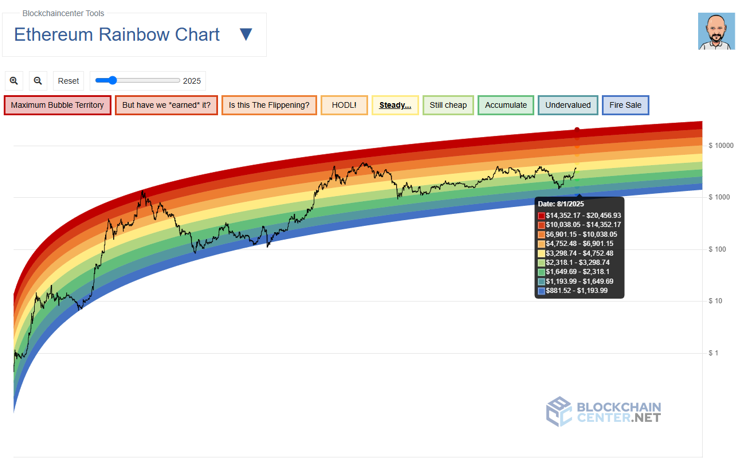
The lowest band on the chart, labeled as “Fire Sale” ($881.52 to $1,193.99), indicates extreme undervaluation. This is followed by “Undervalued” ($1,193.99 to $1,649.69), then “Accumulate” ($1,649.69 to $2,148.10), a range historically favorable for long-term buying.
Above that is the “Still Cheap” band ($2,148.10 to $3,298.74). The next zone is “Steady…” ($3,298.74 to $4,752.48), where Ethereum currently sits, indicating stable growth and reduced volatility.
The “HODL!” zone spans $4,752.48 to $6,901.15, where long-term holders typically strengthen their conviction. Above that is “Is this the Flippening?” ($6,901.15 to $10,038.05), marking the onset of speculation and hype.
Higher up, “But have we earned it?” ranges from $10,038.05 to $14,352.17, and the topmost band, “Maximum Bubble Territory”, spans $14,352.17 to $20,456.93, reflecting peak exuberance.
Ethereum price analysis
At the time of reporting, Ethereum was up 0.47% in the past 24 hours, trading at $3,791. On the weekly timeframe, the asset has gained about 2.5%.
Ethereum’s recent bullish rally, which appears to be targeting the $4,000 level, is supported by key technical indicators. The 50-day simple moving average (SMA) stands at $2,836.31, while the 200-day SMA is at $2,404.22.
The gap between the current price and both SMAs signals a sustained bullish trend, with Ethereum trading well above both its short- and long-term averages.
However, the 14-day Relative Strength Index (RSI) is at 80.01, a level that indicates overbought conditions. While this doesn’t necessarily indicate an imminent reversal, it does suggest that the asset may be due for a short-term pullback or consolidation.
Featured image via Shutterstock

 finbold.com




