Similarly, a coin with a cost basis below the latest price is considered in profit. The NUPL sums up the degree of profit/loss involved in both cases and calculates the difference between them.
When the value of the indicator is positive, it means the investors as a whole are sitting in a state of net unrealized profit. On the other hand, it being under the zero mark implies the dominance of loss in the market.
Now, here is the chart shared by the analytics firm that shows the trend in the Bitcoin NUPL over the past few years:
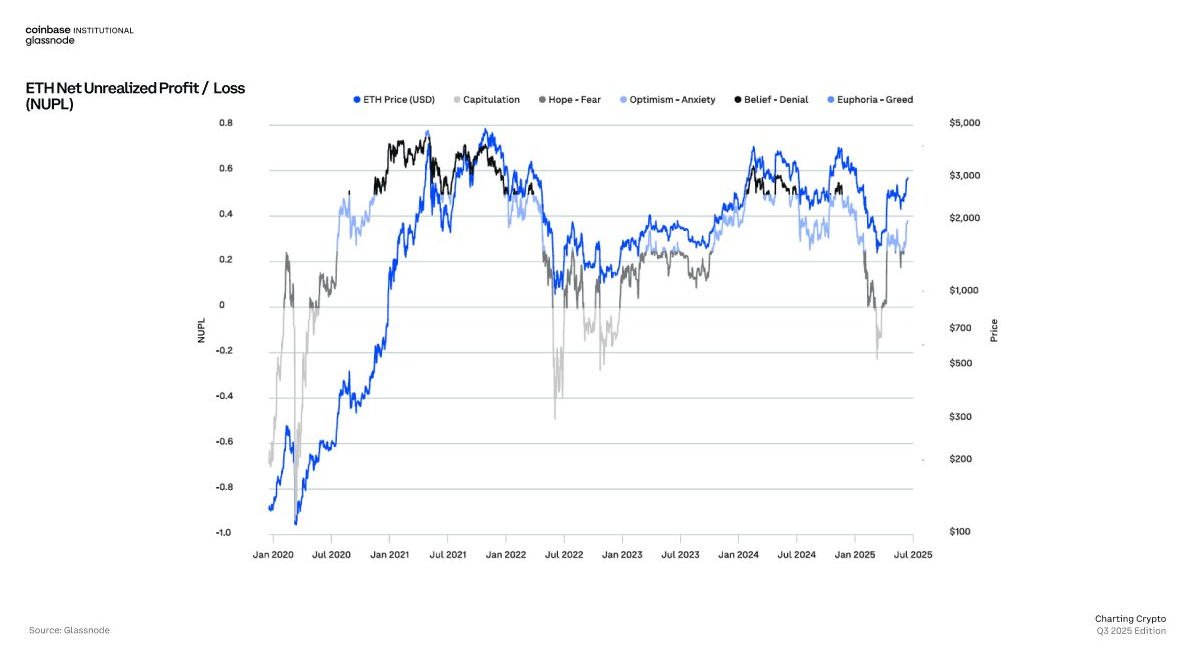
As is visible in the above graph, the Ethereum NUPL observed a significant decline earlier in the year when the asset’s price plummeted. In this plunge, the indicator went down to around -0.2, which suggests investors dipped into a net state of loss.
Not just that, the level of relative unrealized loss present on the network was notable enough for the sentiment to be flagged as “capitulation” under Glassnode’s methodology.
Often, cryptocurrency markets move in the direction that the crowd least expects, so the presence of a high amount of loss can lead to a bottom. From the chart, this seems to be what occurred when the NUPL dropped into the capitulation zone.
With the price surge that has followed since this low, sentiment among Ethereum investors has naturally marked an improvement. The NUPL may be to keep an eye on, however, as once the balance shifts overwhelmingly towards profit, another shift in the market could become probable: this one to a downtrend.
$ETH Price
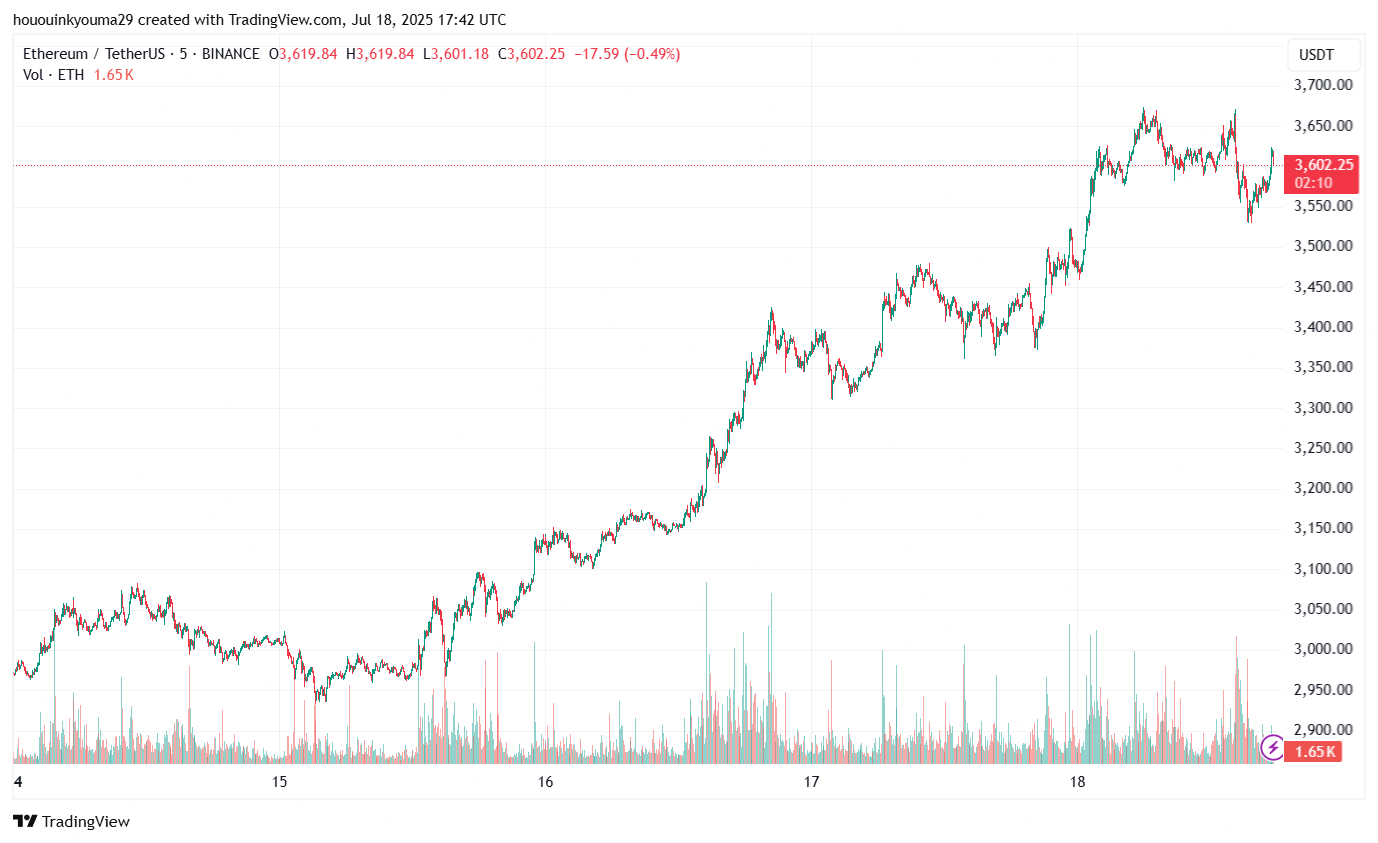
Ethereum has broken away from Bitcoin as its price has jumped by more than 20% over the past week, reaching the $3,600 level.
Featured image from Dall-E, Glassnode.com, chart from TradingView.com

 newsbtc.com




